Wigan Metropolitan Borough Council elections

Wigan Metropolitan Borough Council elections are generally held three years out of every four, with a third of the council being elected each time. Wigan Metropolitan Borough Council, generally known as Wigan Council, is the local authority for the metropolitan borough of Wigan in Greater Manchester, England. Since the last boundary changes in 2004, 75 councillors have been elected from 25 wards.[1]
Political control
From 1889 to 1974 Wigan was a county borough, independent of any county council.[2] Under the Local Government Act 1972 it had its territory enlarged and became a metropolitan borough, with Greater Manchester County Council providing county-level services. The first election to the reconstituted borough council was held in 1973, initially operating as a shadow authority before coming into its revised powers on 1 April 1974. Greater Manchester County Council was abolished in 1986 and Wigan became a unitary authority. Political control of the council since 1973 has been held by the following parties:[3][4]
| Party in control | Years | |
|---|---|---|
| Labour | 1973–present | |
Leadership
The leaders of the council since 1991 have been:[5]
| Councillor | Party | From | To | |
|---|---|---|---|---|
| Peter Smith | Labour | 1991 | 23 May 2018 | |
| David Molyneux | Labour | 23 May 2018 | ||
Council elections
Summary of the council composition after council elections, click on the year for full details of each election. Boundary changes took place for the 1980 election, and more recently the 2004 election – which increased the number of seats by three. Both needed the whole council to be elected in those years.[1]


| Year | Labour | Conservative | Liberal Democrats | Community Action | Independent |
|---|---|---|---|---|---|
| 1973 | 66 | 5 | 0 | 0 | 1 |
| 1975 | 61 | 10 | 1 | 0 | 0 |
| 1976 | 56 | 14 | 1 | 0 | 1 |
| 1978 | 51 | 19 | 1 | 0 | 1 |
| 1979 | 56 | 14 | 1 | 0 | 1 |
| 1980 | 64 | 5 | 3 | 0 | 0 |
| 1982 | 61 | 5 | 6 | 0 | 0 |
| 1983 | 60 | 5 | 7 | 0 | 0 |
| 1984 | 60 | 4 | 8 | 0 | 0 |
| 1986 | 64 | 3 | 5 | 0 | 0 |
| 1987 | 62 | 3 | 6 | 0 | 1 |
| 1988 | 63 | 3 | 5 | 0 | 1 |
| 1990 | 64 | 2 | 5 | 0 | 1 |
| 1991 | 63 | 2 | 6 | 0 | 1 |
| 1992 | 61 | 2 | 8 | 0 | 1 |
| 1994 | 61 | 2 | 8 | 0 | 1 |
| 1995 | 66 | 1 | 4 | 0 | 1 |
| 1996 | 69 | 0 | 2 | 0 | 1 |
| 1998 | 70 | 0 | 1 | 0 | 1 |
| 1999 | 70 | 0 | 2 | 0 | 0 |
| 2000 | 69 | 1 | 2 | 0 | 0 |
| 2002 | 65 | 2 | 3 | 2 | 0 |
| 2003 | 60 | 3 | 4 | 5 | 0 |
| 2004 | 42 | 7 | 8 | 18 | 0 |
| 2006 | 43 | 9 | 8 | 15 | 0 |
| 2007 | 46 | 10 | 6 | 12 | 1 |
| 2008 | 42 | 14 | 4 | 8 | 7 |
| 2010 | 51 | 8 | 3 | 4 | 9 |
| 2011 | 58 | 5 | 2 | 2 | 8 |
| 2012 | 63 | 1 | 2 | 0 | 9 |
| 2014 | 62 | 2 | 0 | 0 | 11 |
| 2015 | 64 | 3 | 0 | 0 | 8 |
| 2016 | 65 | 5 | 0 | 0 | 5 |
| 2018 | 60 | 7 | 0 | 0 | 8 |
| 2019 | 57 | 8 | 0 | 0 | 10 |
| 2021 | 57 | 8 | 0 | 0 | 10 |
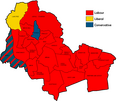
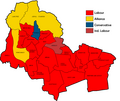
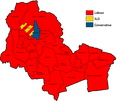
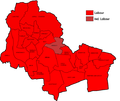
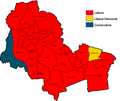
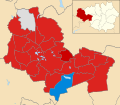
Borough result maps
-
 1973 results map
 -
 1975 results map
 -
 1976 results map
 -
 1978 results map
 -
 1979 results map
 -
 1980 results map
 -
 1981 results map
 -
 1982 results map
 -
 1983 results map
 -
 1984 results map
 -
 1985 results map
 -
 1986 results map
 -
 1987 results map
 -
 1988 results map
 -
 1989 results map
 -
 1990 results map
 -
 1991 results map
 -
 1992 results map
 -
 1993 results map
 -
 1994 results map
 -
 1995 results map
 -
 1996 results map
 -
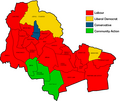 2003 results map
 -
 2004 results map
 -
 2006 results map
 -
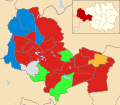 2007 results map
 -
 2008 results map
 -
 2010 results map
 -
 2011 results map
 -
 2012 results map
 -
 2014 results map
 -
 2015 results map
 -
 2016 results map
 -
 2018 results map
 -
 2019 results map
 -
 2021 results map


By-election results
References
- ^ a b "The Borough of Wigan (Electoral Changes) Order 2004", legislation.gov.uk, The National Archives, SI 2004/365, retrieved 30 August 2022
- ^ "Wigan Municipal Borough / County Borough". A Vision of Britain through Time. GB Historical GIS / University of Portsmouth. Retrieved 30 August 2022.
- ^ "Compositions calculator". The Elections Centre. Retrieved 10 August 2022.
- ^ "Wigan". BBC News Online. 19 April 2008. Retrieved 14 March 2010.
- ^ "Council minutes". Wigan Council. Retrieved 30 August 2022.
- ^ a b c "Wigan Metropolitan Borough Council results from 1973 to 2008" (PDF). wigan.gov.uk. Retrieved 30 January 2012. Pgs 50, 55, 82. Asterisks denote sitting councillors, however these candidates are different from that elected the last time the seats were up for election (pgs 35, 40, 67), suggesting the candidate was a victor of an intermediate by-election.
External links
- Wigan Metropolitan Borough Council
