Trinity County, Texas
Trinity County | |
|---|---|
 The Trinity County Courthouse in Groveton | |
 Location within the U.S. state of Texas | |
 Texas's location within the U.S. | |
| Coordinates: 31°05′N 95°07′W / 31.09°N 95.12°W / 31.09; -95.12 | |
| Country | |
| State | |
| Founded | 1850 |
| Named for | Trinity River |
| Seat | Groveton |
| Largest city | Trinity |
| Area | |
| • Total | 714 sq mi (1,850 km2) |
| • Land | 694 sq mi (1,800 km2) |
| • Water | 20 sq mi (50 km2) 2.9% |
| Population (2020) | |
| • Total | 13,602 |
| • Density | 19/sq mi (7.4/km2) |
| Time zone | UTC−6 (Central) |
| • Summer (DST) | UTC−5 (CDT) |
| Congressional district | 17th |
| Website | www.co.trinity.tx.us |
Trinity County is a county located in the U.S. state of Texas. As of the 2020 census, the population was 13,602.[1] Its county seat is Groveton.[2] The county is named for the Trinity River.
Trinity County is included in the Huntsville, TX Micropolitan Statistical Area.
Geography
According to the U.S. Census Bureau, the county has a total area of 714 square miles (1,850 km2), of which 694 square miles (1,800 km2) is land and 20 square miles (52 km2) (2.9%) is water.[3]
Adjacent counties
- Angelina County (northeast)
- Polk County (southeast)
- San Jacinto County (south)
- Walker County (southwest)
- Houston County (northwest)
National protected area
Demographics
| Census | Pop. | Note | %± |
|---|---|---|---|
| 1860 | 4,392 | — | |
| 1870 | 4,141 | −5.7% | |
| 1880 | 4,915 | 18.7% | |
| 1890 | 7,648 | 55.6% | |
| 1900 | 10,976 | 43.5% | |
| 1910 | 12,768 | 16.3% | |
| 1920 | 13,623 | 6.7% | |
| 1930 | 13,637 | 0.1% | |
| 1940 | 13,705 | 0.5% | |
| 1950 | 10,040 | −26.7% | |
| 1960 | 7,539 | −24.9% | |
| 1970 | 7,628 | 1.2% | |
| 1980 | 9,450 | 23.9% | |
| 1990 | 11,445 | 21.1% | |
| 2000 | 13,779 | 20.4% | |
| 2010 | 14,585 | 5.8% | |
| 2020 | 13,602 | −6.7% | |
| U.S. Decennial Census[4]
1850–2010[5] 2010[6] 2020[7] | |||
| Race / Ethnicity | Pop 2010[6] | Pop 2020[7] | % 2010 | % 2020 |
|---|---|---|---|---|
| White alone (NH) | 11,819 | 10,533 | 81.04% | 77.44% |
| Black or African American alone (NH) | 1,377 | 1,086 | 9.44% | 7.98% |
| Native American or Alaska Native alone (NH) | 57 | 29 | 0.39% | 0.21% |
| Asian alone (NH) | 36 | 30 | 0.25% | 0.22% |
| Pacific Islander alone (NH) | 0 | 4 | 0.00% | 0.03% |
| Some Other Race alone (NH) | 13 | 33 | 0.09% | 0.24% |
| Mixed Race/Multi-Racial (NH) | 166 | 573 | 1.14% | 4.21% |
| Hispanic or Latino (any race) | 1,117 | 1,314 | 7.66% | 9.66% |
| Total | 14,585 | 13,602 | 100.00% | 100.00% |
Note: the US Census treats Hispanic/Latino as an ethnic category. This table excludes Latinos from the racial categories and assigns them to a separate category. Hispanics/Latinos can be of any race.
As of the census[8] of 2000, there were 13,779 people, 5,723 households, and 4,000 families residing in the county. The population density was 20 people per square mile (7.7 people/km2). There were 8,141 housing units at an average density of 12 units per square mile (4.6 units/km2). The racial makeup of the county was 83.75% White, 11.92% Black or African American, 0.41% Native American, 0.23% Asian, 0.01% Pacific Islander, 2.66% from other races, and 1.01% from two or more races. 4.85% of the population were Hispanic or Latino of any race.
There were 5,723 households, out of which 25.70% had children under the age of 18 living with them, 55.10% were married couples living together, 11.20% had a female householder with no husband present, and 30.10% were non-families. 26.80% of all households were made up of individuals, and 14.60% had someone living alone who was 65 years of age or older. The average household size was 2.38 and the average family size was 2.85.
In the county, the population was spread out, with 22.90% under the age of 18, 7.00% from 18 to 24, 22.30% from 25 to 44, 25.80% from 45 to 64, and 22.00% who were 65 years of age or older. The median age was 43 years. For every 100 females there were 93.60 males. For every 100 females age 18 and over, there were 90.70 males.
The median income for a household in the county was $27,070, and the median income for a family was $32,304. Males had a median income of $27,518 versus $21,696 for females. The per capita income for the county was $15,472. About 13.20% of families and 17.60% of the population were below the poverty line, including 23.80% of those under age 18 and 13.90% of those age 65 or over.
Education
The following school districts serve Trinity County:
- Apple Springs Independent School District
- Groveton Independent School District
- Trinity Independent School District
- Centerville Independent School District
A small portion of Kennard ISD, located in neighboring Houston County, goes into Trinity County.
The county is in the service area of Angelina College.[9]
Transportation

Major highways
Railroads
Union Pacific operates a freight line running north–south through Trinity County.[10]
Communities
Cities
Census-designated place
Unincorporated communities
Ghost towns
Politics
| Year | Republican | Democratic | Third party | |||
|---|---|---|---|---|---|---|
| No. | % | No. | % | No. | % | |
| 2020 | 5,579 | 80.41% | 1,323 | 19.07% | 36 | 0.52% |
| 2016 | 4,737 | 79.15% | 1,154 | 19.28% | 94 | 1.57% |
| 2012 | 4,537 | 72.77% | 1,614 | 25.89% | 84 | 1.35% |
| 2008 | 4,095 | 67.39% | 1,925 | 31.68% | 57 | 0.94% |
| 2004 | 3,985 | 64.14% | 2,204 | 35.47% | 24 | 0.39% |
| 2000 | 3,093 | 58.39% | 2,142 | 40.44% | 62 | 1.17% |
| 1996 | 2,058 | 38.76% | 2,774 | 52.24% | 478 | 9.00% |
| 1992 | 1,988 | 33.64% | 2,784 | 47.11% | 1,137 | 19.24% |
| 1988 | 2,448 | 47.65% | 2,657 | 51.72% | 32 | 0.62% |
| 1984 | 2,599 | 54.89% | 2,115 | 44.67% | 21 | 0.44% |
| 1980 | 1,503 | 36.95% | 2,510 | 61.70% | 55 | 1.35% |
| 1976 | 1,042 | 33.04% | 2,100 | 66.58% | 12 | 0.38% |
| 1972 | 1,467 | 63.92% | 826 | 35.99% | 2 | 0.09% |
| 1968 | 636 | 22.89% | 1,146 | 41.24% | 997 | 35.88% |
| 1964 | 763 | 31.43% | 1,654 | 68.12% | 11 | 0.45% |
| 1960 | 707 | 31.23% | 1,521 | 67.18% | 36 | 1.59% |
| 1956 | 865 | 43.98% | 1,091 | 55.47% | 11 | 0.56% |
| 1952 | 958 | 35.71% | 1,725 | 64.29% | 0 | 0.00% |
| 1948 | 150 | 11.41% | 905 | 68.82% | 260 | 19.77% |
| 1944 | 127 | 8.20% | 1,132 | 73.13% | 289 | 18.67% |
| 1940 | 274 | 13.24% | 1,791 | 86.56% | 4 | 0.19% |
| 1936 | 151 | 11.20% | 1,196 | 88.72% | 1 | 0.07% |
| 1932 | 65 | 4.11% | 1,514 | 95.70% | 3 | 0.19% |
| 1928 | 456 | 39.93% | 686 | 60.07% | 0 | 0.00% |
| 1924 | 146 | 8.63% | 1,504 | 88.89% | 42 | 2.48% |
| 1920 | 125 | 11.08% | 643 | 57.00% | 360 | 31.91% |
| 1916 | 156 | 13.51% | 906 | 78.44% | 93 | 8.05% |
| 1912 | 112 | 11.85% | 657 | 69.52% | 176 | 18.62% |
See also
- National Register of Historic Places listings in Trinity County, Texas
- Recorded Texas Historic Landmarks in Trinity County
References
- ^ "Trinity County, Texas". United States Census Bureau. Retrieved February 23, 2021.
- ^ "Find a County". National Association of Counties. Retrieved June 7, 2011.
- ^ "2010 Census Gazetteer Files". United States Census Bureau. August 22, 2012. Retrieved May 11, 2015.
- ^ "Decennial Census of Population and Housing by Decades". US Census Bureau.
- ^ "Texas Almanac: Population History of Counties from 1850–2010" (PDF). Texas Almanac. Archived (PDF) from the original on March 19, 2013. Retrieved May 11, 2015.
- ^ a b "P2 HISPANIC OR LATINO, AND NOT HISPANIC OR LATINO BY RACE - 2010: DEC Redistricting Data (PL 94-171) - Trinity County, Texas". United States Census Bureau.
- ^ a b "P2 HISPANIC OR LATINO, AND NOT HISPANIC OR LATINO BY RACE - 2020: DEC Redistricting Data (PL 94-171) - Trinity County, Texas". United States Census Bureau.
- ^ "U.S. Census website". United States Census Bureau. Retrieved May 14, 2011.
- ^ Texas Education Code, Sec. 130.165. ANGELINA COUNTY JUNIOR COLLEGE DISTRICT SERVICE AREA..
- ^ National Atlas Archived 2008-05-11 at the Wayback Machine
- ^ Leip, David. "Dave Leip's Atlas of U.S. Presidential Elections". uselectionatlas.org. Retrieved April 11, 2018.
External links
![]() Media related to Trinity County, Texas at Wikimedia Commons
Media related to Trinity County, Texas at Wikimedia Commons
- Trinity County government's website
- Trinity County from the Handbook of Texas Online
- Groveton Times & Trinity Standard
- A History Of Trinity County 1827-1928 by Flora Gatlin Bowles
- Cadastral Map of Trinity County 1857 by John Baumgarthen
- Cadastral Map of Trinity County 1882 by V Schmidt
Places adjacent to Trinity County, Texas | ||||||||||||||||
|---|---|---|---|---|---|---|---|---|---|---|---|---|---|---|---|---|
| ||||||||||||||||
Municipalities and communities of Trinity County, Texas, United States | ||
|---|---|---|
| Cities | 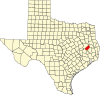 | |
| CDP | ||
| Other unincorporated communities | ||
| Ghost towns | ||
| Footnotes | ‡This populated place also has portions in an adjacent county or counties | |
31°05′N 95°07′W / 31.09°N 95.12°W / 31.09; -95.12