This is an archive of past discussions. Do not edit the contents of this page. If you wish to start a new discussion or revive an old one, please do so on the current talk page.
Recently there has been a spirited discussion of improving the Greenhouse effect article, involving User:Rhwentworth, User:Efbrazil and me. A recent major change in the lead has been to avoid saying that greenhouse gases themselves absorb and then re-emit heat—a statement that is a technically inaccurate description of the GHE mechanism.
As (esp.) User:Rhwentworth can explain in more detail, the true mechanism of the GHE is more subtle: (lower-temperature) GHGs in the upper-atmosphere emit less thermal radiation than (warmer-temperature) GHGs near the Earth's surface. Rather than using jargon like "thermal radiation" in the lead, however, I propose adopting the approach in the Greenhouse effect lead: making the language friendly for lay readers, while being consistent with the techy details but without reciting the techy details.
Current wording (9 June)
Proposed wording
... Greenhouse gases absorb some of the heat that the Earth radiates after it warms from sunlight. Larger amounts of these gases trap more heat in Earth's lower atmosphere, causing global warming.
... Greenhouse gases in the atmosphere cause some of the energy radiated from the Earth's warmed surface to build up at the surface rather than escape into space. Larger amounts of these gases cause more heat to accumulate in Earth's lower atmosphere, causing global warming.
Feel free to add your own proposed wording to new column(s) in the above chart. —RCraig09 (talk) 22:03, 9 June 2023 (UTC)
I prefer the old version for readability reasons. It's a correct statement, as this is the collective action of GHG in the atmosphere (given the lapse rate). There is some minor duplication of information between the two sentences now as well (location of heat accumulation). Femke (alt) (talk) 07:05, 10 June 2023 (UTC)
I also prefer the current wording Efbrazil (talk) 01:51, 11 June 2023 (UTC)
User:Femke (alt)User:Efbrazil I started this section in response to the objections and changes that User:Rhwentworth has raised and made at Greenhouse gases. I was OK with the existing language here, until reading his contributions there. @Rhwentworth: can you comment on whether the current language here, is acceptable to you? Do you have a proposed change, here, yourself? —RCraig09 (talk) 04:43, 11 June 2023 (UTC)
Interesting. I am trying to catch up on the "spirited discussion at greenhouse effect"... I quite like the new wording in your table above although I wonder what is meant with "at the surface". Is that directly at the surface (interface with the ground) or is it higher up? If you've changed it in the lead of greenhouse effect then I guess it would be more consistent to also change it here (?). EMsmile (talk) 21:54, 6 July 2023 (UTC)
A simple exponential model for CO2 concentration and corresponding temperature increase.
A simple exponential model for CO2 concentration and corresponding temperature increase.
A simple model using a single exponential function was used to fit the existing (NOAA) CO2 data. Based on the fit, a prediction of the temperature rise is predicted. Despite global effort and discussion, the trend is remarkably simple, following a single expontial function, △T = 0.041*exp((yr-1797)/61.23), predicting 2.6 degC increase in 2050 and 5.7 degC increase in 2100. The fit model predicts the industrial revolution started in 1797 and the preindustrial CO2 concentration of 256 ppm. Hoydooyou (talk) 20:38, 19 July 2023 (UTC)
File:CO2-prediciton-simple-exponential.pngCaption
— Preceding unsigned comment added by Hoydooyou (talk • contribs) 20:56, 19 July 2023 (UTC)
Overuse of IPCC as a source?
Just had an interesting conversation with my father about this article, he said he didn't like it because there was too much use of the IPCC sourcing because he was suspiscious about the models and then talked about how he had found some youtubers who worked at NASA who were more trustworthy.
Now, I'm quite aware that if one is sufficiently motivated on a topic you can start dismissing every source. But I've also gone deep enough in enough literatures over the last few years to understand issues surrounding policy cherry picking and misrepresenting literature, and a large number of us in the UK have been through periods of authoritatrian restrictions based on models, together with documented political manipulation of "official" scientific opinion to increase compliance and the sometimes political actions of the world health organization and CDC such that I can't really blame people for being distrustful of the IPCC and modelling.
On other topics I've worked on (see WP:MEDRS) you often have a parallel track of systematic reviews from academic and policy publications which tends to balance one another. Do you think it would be possible to use systematic reviews rather than or together with the IPCC for some of the factual claims about what is actually going on rather than what is modelled, and stress the modelling / data distinction. If we want to turn this sort of question into wikipedia policy / essays we could use WP:BESTSOURCE, WP:ACADEMIC and WP:DUE as justification. Talpedia 12:20, 30 July 2023 (UTC)
I've always perceived that IPCC publications have been non-exclusive sources in climate change-related articles, and that IPCC publications are often relied on because they function somewhat analogous to review articles in the WP:MEDRS area. They are exhaustively sourced, themselves. Separately, consider that the data-vs-model dichotomy is usually distinguished by past occurrences versus projections of the future; I think readers are aware of this distinction. —RCraig09 (talk) 17:40, 30 July 2023 (UTC)
somewhat analogous to review articles
I would agree, but also there is a little conflict of interest involved in mixing observation, modelling and policy within the same organization. I'm quite used to e.g. best practice from someone like NICE in the UK playing a little loose with the evidence. If I have energy I might go through and try to add secondary non IPCC sources for historic claims. Talpedia 19:46, 30 July 2023 (UTC)
Part of the advantage of using the IPCC is they are a forum for deciding what middle of the road science on the topic is. Without a filter like the IPCC, we could end up with an article sourced to alarmist Guardian projections. The goal of filtering to NASA / NOAA / IPCC is to focus the article on consensus science.
Good point that the IPCC isn't perfect and mixes policy with projections. Perhaps if you could find autoritative sources critiquing IPCC publications that would be good to include. I don't know of a better consensus forum than the IPCC, but authoritative critiques of that consensus could be valuable to include. Efbrazil (talk) 16:52, 31 July 2023 (UTC)
AMS
Is this accurate?: "A survey of members of the American Meteorological Society found that only 30% said they have concerns about rising temperatures." (Source: https://presidentialhill.com/greta-thunberg-fined-for-disobeying-police/) If so, shouldn't it be mentioned? Kdammers (talk) 13:57, 4 August 2023 (UTC)
That news source looks to just be ideological click bait. We need a link to the AMS source data or study, if it exists. Efbrazil (talk) 14:22, 4 August 2023 (UTC)
I think that wording is biased and somewhat inaccurate. Assuming this is the same survey that the article mentioned cites, 30% said very worried and 42% said somewhat worried. So the majority of that survey said they were worried to some degree. This is also a survey from over a decade ago mind you.
Not sure were to add this "Climate change: World's hottest day since records began", see
https://www.bbc.com/news/science-environment-66104822 Uwappa (talk) 04:50, 5 July 2023 (UTC)
Not sure that really needs to be included... There are going to be repeated new hottest days as the world heats, so this would be a moving target and not that remarkable given the general context. — Amakuru (talk) 06:32, 5 July 2023 (UTC)
I agree. The text should not have an ever growing list of daily highs. Graphs will do fine.
The July high turned out to be more than some hot days. June and July were hottest months ever recorded. Also the oceans are warmer than the past 4 decades, see graph of SST, Sea Surface Temperature at: https://climatereanalyzer.org/clim/sst_daily/
See how April, May, June, July 2023 are far out of bandwidth. Uwappa (talk) 18:45, 31 July 2023 (UTC)
August starts far out of bandwidth with alarming SST record:
BBC: Ocean heat record broken, with grim implications for the planet Uwappa (talk) 19:08, 4 August 2023 (UTC)
I agree we need to keep our eyes open for data showing that the IPCC estimates are wrong or we have definitive proof we are heading into something like an abrupt shutdown of AMOC. Despite the alarming data this summer, I have not heard it said that the heating we are seeing is out of line with the pivot from la nina to el nina, coupled with climate change of course: https://www.climate.gov/enso Efbrazil (talk) 18:03, 5 August 2023 (UTC)
Changes in the lead
AR6 SYR is out for the most part, although the full report is not available yet. Given what the SPM says about adaptation, I adjusted the wording in the relevant sentence in the lead.[1]
SYR SPM also has relevant content for the climate justice sentence in the lead, which does not currently have a source.
Vulnerable communities who have historically
contributed the least to current climate change are disproportionately affected (high confidence)
...
Approximately 3.3–3.6 billion people live in contexts that are highly vulnerable to climate change. Human
and ecosystem vulnerability are interdependent. Regions and people with considerable development constraints
have high vulnerability to climatic hazards. Increasing weather and climate extreme events have exposed
millions of people to acute food insecurity12 and reduced water security, with the largest adverse impacts
observed in many locations and/or communities in Africa, Asia, Central and South America, LDCs, Small
Islands and the Arctic, and globally for Indigenous Peoples, small-scale food producers and low-income
households. Between 2010 and 2020, human mortality from floods, droughts and storms was 15 times higher
in highly vulnerable regions, compared to regions with very low vulnerability. (high confidence) (p.5)
I suggest changing the current sentence "Poorer countries are responsible for a small share of global emissions, yet they have the least ability to adapt and are most vulnerable to climate change." to "Communities with the least contribution to current climate change are affected disproportionately, and large part of the world population is highly vulnerable" Bogazicili (talk) 09:10, 19 April 2023 (UTC)
The readability of the current sentence is much better, but the information conveyed seems quite similar. Why do you think your new sentence is better? —Femke 🐦 (talk) 16:25, 19 April 2023 (UTC)
Femke, sorry for late reply. "Communities with least contribution" is different than "poorer countries". It might include low income households in developed countries for example (mentioned in the quote above as more vulnerable). "large part of the world population is highly vulnerable" is also different than the current wording. Current wording sounds like only Least developed countries are vulnerable. Many mid, upper middle income countries are also quite vulnerable. Bogazicili (talk) 20:51, 9 June 2023 (UTC)
I updated this sentence and now there's also a proper source.Bogazicili (talk) 06:57, 26 August 2023 (UTC)
I partly backed out the change. I did leave the swap in from "countries" to "communities", as you raise a good point that climate just is not just an issue of nationhood, but also communities within nations. I left the new source in as well.
As for the rest, I agree with Femke, with these specific issues:
The two halves of the new sentence became disconnected ideas, the whole point is the connection between the two halves of the sentence.
Disproportional to what? Disproportional is jargon and requires a high reading level, and it doesn't even make sense here. We need to talk to people without background in the field.
It loses a lot of information that exists in the existing sentence, like the ability to adapt and responsibility for cumulative CO2 in the atmosphere. I'm not sure what is gained in the new wording, it mostly seemed to turn a pointed and clear sentence into something more vague and jargony.
Then you will need to find a source for your wording. There is not even the word "poor" in the page 5 of the source I added. What you wrote is also incorrect when you generalize it in the way that you worded. Russia is poorer than Sweden for example, but has much higher per capita greenhouse emissions. Bogazicili (talk) 09:22, 27 August 2023 (UTC)
Certainly the case is easiest to make when comparing first world economies with developing economies, not with those of manufacturing or fossil fuel based economies like Russia. Another factor to consider is comparing cumulative emissions with wealth, not current emissions with wealth. Cumulative emissions is usually what's taken to be "responsibility". Wealthy post-industrial economies built their wealth through industrial practices and now have the luxury of consuming goods produced off shore.
The text is a synopsis of what's in the article and was considered non controversial. We generally aren't sourcing the lead unless necessary. Is the clarification above enough for you, or do you think we need to bring forward article sources to back it up? Efbrazil (talk) 23:33, 27 August 2023 (UTC)
Having sources to back that up is a good idea. I added citations supporting the claim regarding poor community responsibility for and vulnerability to climate change, removing the citation needed flag (3rd para of the lede). This was a big topic of the recent COP27 in Egypt, and I suspect it will continue to be a major point of contention in the future. SteveChervitzTrutane (talk) 23:34, 30 August 2023 (UTC)
New subsection "Temperature records prior to global warming"
The "Observed temperature rise" section had a fair bit of content that was not observations of global warming, but rather statements about temperatures prior to the onset of global warming. Further, that content wasn't organized in any way, just randomly interspersed as far as I could tell, making for a tough read in an excessively long section.
I separated that content out into a new subsection. I think it could be improved to better put global warming in historical and prehistorical context. I personally would be happy to see the existing content on "Observed temperature rise" cut by a paragraph or two in exchange for adding a paragraph or two to the new section. Efbrazil (talk) 19:06, 5 August 2023 (UTC)
Kudos on an effective reorganization. Re shortening /* Observed temperature rise */... I see your point. The second paragraph of the section focuses more on impacts that confirm the temperature rise, rather than the temperature rise itself. Unfortunately, shortening that section too much might make the Ocean Heat Content chart (which I see as important esp. because of its caption) spill over into the next section. —RCraig09 (talk) 19:33, 5 August 2023 (UTC)
Thanks! I added a sentence on temperatures during the period of human evolution / ice ages and think that's good enough for me. It helps to ground current climate change in the context of evolutionary compatibility. The Paleocene–Eocene Thermal Maximum is interesting to understand, but is a lot closer to the time of dinosaurs than it is to modern times. Efbrazil (talk) 17:33, 6 August 2023 (UTC)
@Efbrazil: I don't see how the source you added fully support the sentence. It does not mention evolution, or make that connection. I also doubt the -5 to current temps. From memory, it's more like -6 to -0.5 compared to current temperatures.
Happy with making this into a subsection; it seems a common request from people who pop in with a single request. —Femke 🐦 (talk) 16:29, 30 August 2023 (UTC)
I corrected the sourcing to include both the hot and cold articles, if you know a better source please point me that way. The main thing in the source that I'm using is the graph in the hottest article plus the text saying "The latest ice age peaked about 20,000 years ago, when global temperatures were likely about 10°F (5°C) colder than today." With global warming it's a moving target of course, but based on the chart they include the lowest ice age temperatures were about 4.6°C colder than 1850-1900, so about 5.8°C colder than today.
Glad you'd like to see the area expanded as well. I got other fish to fry right now, but if you have good sources on the topic please share. Efbrazil (talk) 15:58, 31 August 2023 (UTC)
Intellectually dishonest presentation of the subject of climate change
I'm closing this per multiple suggestions. Discussing "criticism" and what to include without pointing to high-quality secondary sourcing is not fruitful. —Femke 🐦 (talk) 18:42, 3 September 2023 (UTC)
The following discussion is closed. Please do not modify it. Subsequent comments should be made on the appropriate discussion page. No further edits should be made to this discussion.
I am a long time user, small donor, and believer in Wikipedia, so my suggestion herein is to only make it better. Wikipedia's presentation of its article on 'Climate change' needs a specific improvement. I wanted to refer some impressionable youngsters to Wiki to be educated on this subject, but the current article is intellectually dishonest, and does not completely follow the science. After reading the article, one is left with the impression that humans are the sole or major cause of what is referred to as the current climate crisis. This may well be true, but it may be equally or more so valid that the cause of contemporary climate change is the same force(s) which triggered the historic recession and growth of the Earth's ice ages, i.e. dynamics such as changes in Earth's orbit or axial tilt, etc., as discussed in the Wiki articles under 'Climate variability and change' and 'Ice age'. But just referring the reader elsewhere for this important content is insufficient. It is this _headlining_ article on climate change that should present these two competing theories for the cause of contemporary climate change - naturally occurring vs. human-caused, and discuss the arguments for and against, which arguments are lacking elsewhere in Wiki, as far as I can tell. Without this, Wikipedia leaves itself open to the charge of agenda-based propaganda. But more importantly, the youngsters that I wish to refer to Wiki for education on climate change will not be taught the subject according to the science, just _some_ of the science. Keplic (talk) 16:29, 15 August 2023 (UTC)
Wikipedia is supposed to summarize the knowledge of mankind. Your suggestion would remove part of the knowledge of mankind and replace it by the ignorance a certain part of mankind wants to be promoted (see climate change denial) by pretending that it is less reliable than it actually is.
I wish that fewer people would automatically draw from "Wikipedia differs from my opinion" the conclusion "Wikipedia is wrong". --Hob Gadling (talk) 16:51, 15 August 2023 (UTC)
Keplic, scientists have nearly unanimously concluded that only one of your two perceived "competing theories" is correct: see Scientific consensus on climate change, especially the peer-reviewed studies of scientific consensus. Obviously, scientists have considered Earth's orbit and axis tilt, etc. etc. and come to a solid conclusion that humans are causing current global warming. —RCraig09 (talk) 17:30, 15 August 2023 (UTC)
Hob Gadling, please look again. Nothing in my comments denies climate change, or proposes to remove or replace any knowledge, but instead, would _add_ knowledge to this headlining article, namely that there are other theories for explaining contemporary climate change. We should be confident enough in our studies and thinking to present both sides of an argument, and allow the readers to draw their own conclusions. Keplic (talk) 14:37, 16 August 2023 (UTC)
That is an incorrect way to operate both scholarly and by Wikipedia's policies. "Presenting both sides, and let the readers decide" sounds great, but in practice that only works when "both sides" have somewhere near equal merit. In the case of climate change, as with many other things, "both sides" do not have equal merit. See WP:NPOV, WP:PARITY, and WP:UNDUE. There are people who believe in Young Earth Creationism instead of the theory of evolution, but we do not give them equal weight and "let the reader decide." Indeed, I'll quote an example from one of the pages I've referred you to: "'According to Simon Wiesenthal, the Holocaust was a program of extermination of the Jewish people in Germany, but David Irving disputes this analysis' would be to give apparent parity between the supermajority view and a tiny minority view..." I'm sure if I try hard enough, I can find people who think cyanide is not toxic, but we're not going to present both the supermajority scientific view that cyanide is highly toxic and a minority view that it isn't, and "let the reader decide." Similarly, we have an overwhelming supermajority (near 100%) of scientists in relevant fields and peer reviewed publications in real (and not predatory "pay to play") journals that our current climate change and warming is due to human activity, and a very small minority of scientists in relevant fields and publications arguing against human activity driving contemporary climate change. By our own policies and by the ethics of scholarly conduct, we cannot and will not present both sides with anywhere near equal weight or parity and just "leave it to the reader to decide." The sky isn't polka-dotted, after all. --OuroborosCobra (talk) 16:28, 16 August 2023 (UTC)
Exactly. I just want to add that uncertainty about the causes is exactly the story the denialists want to tell. They have succeeded in this disinformation campaign for decades. So, yes, Keplic, your suggestion that "there are other theories" is the very core of climate change denial. --Hob Gadling (talk) 07:42, 17 August 2023 (UTC)
I'm following along here and have mixed sympathies, but do think that criticism would enhance this article, and that either way there should be a much better introduction and use of the IPCC.
I think what may be missed currently is that there's reasonable science and criticism going on between the broad consensus and the denialism.
As it is, the article occasionally notes uncertainties (mostly in the past) but reads as if the IPCC science is "settled" (as discussed above) and that there are no credible criticisms on any topic related to Climate Change that could be of any interest to the reader, be they from the scientific or lay community. This is misleading, especially in relation to the IPCC's science work as of AR6.
To the contrary, while the AR6 Foreward starts: "It is unequivocal that human activities have heated our climate" it is overall "a report that provides a better understanding of the climate system"; far from a finishing mic drop.
I've read the report for many hours (it's 733 pages of very heavy reading) and have not yet found any notion that any of the relevant science is "settled"; a word which itself does not show up in the report at all.
Proposal: Promote History, Introduce an IPCC section, add Criticism
There are currently a few references to the IPCC's work in the main text of this article, though it makes up about ~200 of ~400 total references. That indicates both that there's a very large use of IPCC information in the article, but also that it's being conflated with other work of varying academic quality and historical relevance.
This article should introduce a section clearly summarizing the IPCC's work, and then two section about Science and then their derived Policy recommendations.
I think this would allow significant simplification of the entire article by moving most of the discussion into a current broad consensus picture, represented by the IPCC, and moving most other exposition into the History section. The History section itself should be medium length and early in the article to setup for this. The Criticism section should be a summary of scientific and public policy criticism, probably linking out to separate full-length articles.
IPCC Science and Policy Dichotomy
There's a very relevant dichotomy in how the IPCC approaches this topic, which is to distinguish the science from the policy, which is always a source of tension in complex topics with major impact.
The IPCC accommodates this tension by producing two headline reports, one that synthesizes the science (the Physical Science Basis, e.g. AR6PSB) with a goal of understanding the wide ranging research activities and conclusions, with great and careful use of a rubric of confidence in observations and likelihood of predictions.
It may also be useful to link readers to resources about the nature of Public Policy ethics to better understand this relationship.
IPCC Rubric
The following rubric should be explicitly introduced and used throughout the IPCC section text:
"...confidence is expressed using five qualifiers: very low, low, medium, high and very high.... The following terms have been used to indicate the assessed likelihood of an outcome or result: virtually certain 99–100% probability; very likely 90–100%; likely 66–100%; about as likely as not 33–66%; unlikely 0–33%; very unlikely 0–10%; and exceptionally unlikely 0–1%" - AR6PSB p4, note4
Example: Aerosols
The current article's section on Aerosols has a dozen ore more propositions with no qualifiers on certainty; which in fact read as certain. There's one exception: "Indirect effects of aerosols are the largest uncertainty in radiative forcing."
Compare this to AR6:
"However, due to their complexity and the difficulty of obtaining precise measurements, aerosol effects have been consistently assessed as the largest single source of uncertainty in estimating total [Radiative Forcing]" p181, AR6PSB
An improved section would include some of the lower-confidence qualifies from AR6 to convey this.
Example: Modeling
The modeling section mentions a few historical modeling problems as being resolved, then notes one reservation ("climate models may still be underestimating or missing relevant feedback processes") but otherwise doesn't convey nearly the right magnitude of complexity of climate modeling, which is a canonical example of hypercomplex modeling. Indeed, the only mention of "complex" anything in the article is about the geopolitics of CC. That's misleading.
Criticism
The Criticism section should acknowledge a major scientific consensus by the IPCC results, and then articulate the main points of contention in both scientific spheres and also in the public.
Scientific Criticism
The introduction here should restate the consensus opinion, but also highlight areas of highest uncertainty and upcoming work, including difficulties in global sensing, complexity of modeling in general and predicting feedbacks in particular.
Then, within this setting, some highlighted topics and highlighted critics.
Criticism: Highlighted Topics
Causal problems with CO2 trailing warming
Correlational problems of long-term historical climate variability
Massive greening of Earth from CO2, and potential enhancement of net improvement in biospheric health
Uncertainty of the role of aerosols, esp clouds and the role plant/cloud interactions plays in biospheric self-regulation
Unexpected warming effects of reduced emissions during Covid
Unexpected warming effects of reductions in shipping pollution
A full list of critics for consideration; refer to their articles for their arguments:
Richard S. Lindzen, PhD Atmospheric Physics, National Academy of Science, Harvard, Princeton, Massachusetts Institute of Technology (MIT), U Washington, U Copenhagen, U Oslo, U Chicago, National Center for Atmospheric Research, Cato Institute
John Clauser, PhD Physics, Nobel Prize in Physics 2022 (Quantum Mechanics), UC Berkeley, Lawrence Livermore National Labs (LLNL), Lawrence Berkeley National Labs (LBNL), CO2 Coalition
Ivar Giaever, Physics, Nobel Prize in Physics 1973 (Quantum Mechanics), National Academy of Engineering
Richard S. Lindzen is a contributor to the IPCC and yet a notable critic on both relevant science and also the translation of the science to public policy.
Surely his wide-ranging criticisms of the IPCC science would benefit the reader in their understanding? These are complex topics that often get politicized. His work is not blanket denialism. Instead, there's a lot to be learned from what he agrees with and what he doesn't.
Public Criticism & Public Policy
This would take more work here in Talk to elaborate, but e.g. while most think there's warming, there's a major split in causes (recent US poling shows ~50% think it's human caused). This could be useful compared to scientific consensus and denialism and also highlight notable and constructive criticism from both spheres for consideration.
Example: Bjørn Lomborg
Bjørn Lomborg's criticism is of Public Policy related to CC, is notable and constructive. Pablo Mayrgundter (talk) 00:37, 18 August 2023 (UTC)
Lomborg is a scientific layman ho makes heaps of rookie mistakes; Moore, Happer, Clauser and Giaever have scientific educations but have not done any scientific research about climate, have no clue about it, and say clearly false things about it; the only competent one is Lindzen, who had a hypothesis that was falsfied decades ago but still clings to it.
Read WP:ONEWAY. Those people are handled on their own pages. We do not add creationist ideas to Evolution or flat-earther ideas to Earth either.
I think we should close this thread. It only encourages denialists and their apologists to add their unfounded opinions. --Hob Gadling (talk) 07:49, 18 August 2023 (UTC)
I think we should welcome other opinions at talk pages and use them to improve Wikipedia articles.
See "The Great Resistor" at page 23 of https://dragondreaming.org/wp-content/uploads/2020/01/DragonDreaming_eBook_english_V02.09.pdf#page=23
for an abundance of other opinions: https://www.conservapedia.com/Global_warming
for a smile or two: https://uncyclopedia.com/wiki/Global_warming
It seems you do not understand what Wikipedia Talk pages are for. Read WP:NOTFORUM.
This page is for improving the article, and the links you provided are not useable for improving the article. Wikis are not RS because of WP:SPS and Conservapedia is doubly not RS because of WP:LUNATICS: they get pretty much all science wrong. That silly dragon thing can be recognized as unuseable without even reading anything in it. --Hob Gadling (talk) 12:45, 19 August 2023 (UTC)
I agree with Hob Gadling on this issue. Since the burden is on the editor wanting to include content, we shouldn't "welcome" unreliable sources, even on Talk Pages. —RCraig09 (talk) 13:09, 19 August 2023 (UTC)
Are your only objections to the particular list of critics? I would like to proceed with the other edits once we hear from others here.
Taking your main comment into consideration, I did find a more relevant summary criticism, an open letter to the American Physical Society, that includes Happer and Giaever, amongst a total of 54 "physicists who are familiar with the science issues" related to climate change.
Unlike your claim that they have no clue, it seems clear to me that these are scientists who probably do have a considered understanding and yet are in disagreement. If consensus matters, then so does dissent.
I also think this can hardly be fringe theory of the likes of creationism or flat earthing and suggest discussions here refrain from that line of minimization.
Their statement here could be linked and that would be a fine addition.https://ligould.com/Open%20Letter%20to%20the%20Council%20of%20the%20American%20Physical%20Society.pdf Pablo Mayrgundter (talk) 20:56, 19 August 2023 (UTC)
This article has existed since 2001. There is a good reason that it concentrates on the science and ignores silly open letters initiated by ideology think tanks and signed by a tiny amount of people with letters behind their names. You may find discussions about this in the archives.
Unlike your claim that they have no clue, it seems clear to me that these are scientists who probably do have a considered understanding and yet are in disagreement False. You do not seem to understand how science does not work. Scientists typically have one specialty, about which they know a real lot. In that area, they publish reliable sources. As soon as they leave their specialty, they are just normal people with opinions: They may get it right, or they may not. Their opinions about subjects outside their specialty can be more influenced by their political position than by the scientific facts. "Open letters" signed by everybody who loves free markets and by their dog are not relevant for science. Publications in scientific journals are relevant for science, and denialists typically do not succeed or even try to publish their opinions in scientific journals (there are exceptions such as Willie Soon). Denialists are just an anti-science movement without connection to scientific research, except that they want to prevent it and tell lies about it.
Climate change denial is a consequence of free-market ideology. It is at home in free-market think tanks, and that is the place where the reasoning is generated. The existence of scientists who also believe in it is incidental, just as with creationism, who also have open letters signed by people with academic credentials, and who are also an anti-science movement without connection to scientific research. And yes, it is a fringe theory.
We already have articles about the denialist manufactroversy. The users who are working on this article are all aware of that, and that (as well as WP:ONEWAY) is the reason why denialists are not prominent in this article. You may find allies in economy noticeboards who have the same misconceptions as you about the scientific consensus on climate change, but the competent people who wrote this article are a completely different set of users.
You could have found out all that by reading our articles about climate change denial and scientific consensus on climate change, and maybe I should just have linked those and written nothing else. Denialism is pseudoscience and does not belong here. --Hob Gadling (talk) 06:10, 20 August 2023 (UTC)
Sorry, this seems like you're setting pretty arbitrary bounds here and relying strongly on your opinion vs what can be shown objectively. Is the original APS letter in support of the consensus also just a silly letter due to it being from the wrong source? How do you know the motivations involved? I think this discussion will benefit from avoiding any sort of ad hominem, refraining from simple assertions without evidence or introducing opinion.
Could you please provide a sketch example that would distinguish Fringe (WP:FRINGE/QS), Questionable (WP:FRINGE/QS) and Alternative (WP:FRINGE/ALT) science on Climate Change?
Otherwise, I'm having difficulty thinking you'll find any mention of criticism in this article as a good edit. Pablo Mayrgundter (talk) 01:04, 21 August 2023 (UTC)
relying strongly on your opinion No, I am relying strongly on what is published in reliable sources. See WP:RS.
Is the original APS letter in support of the consensus also just a silly letter due to it being from the wrong source? No, it is just not relevant for what the consensus is. Scientific journals are.
Could you please provide For the hundredth time: This page is for discussing improvements to the article.
Alternative science There is no such thing. There is science, and there is non-science. Climate change denial is non-science.
The essential point is that this is a scientific subject and needs scientific sources. Scientific sources are scientific journals, not journalistic sources written by people who happen to be scientists (unless they explain the same thing better than the journals do without deviating from them). Starting from that method, the article will always naturally end up being in favor of the science and not in favor of free-market ideology and its propaganda tool, denialism.
Can we now stop this? It only clutters the Talk page and leads nowhere. Pro-denial users, please educate yourselves somewhere else, preferrably at more honest places than you did earlier. --Hob Gadling (talk) 06:03, 21 August 2023 (UTC)
So, let's focus on the APS letter and dissent.
Your claim that only journals are admissible is incorrect. Both the original APS letter and dissent are clearly WP:RS:
"Reliable sources on Wikipedia may include peer-reviewed journals; books published by university presses; university-level textbooks; magazines, journals, and books published by respected publishing houses; and mainstream newspapers. Academic and peer-reviewed publications are usually the most reliable sources in areas where they are available, but material from reliable non-academic sources may also be used in these areas."
And you're not following this guidance:
"Wikipedia articles should be based on reliable, published sources, making sure that all majority and significant minority views that have appeared in those sources are covered "
The original letter and the dissent examples of the majority and significant minority (here 54 members) views from that organization.
The type of scientific statement in the open letter is WP:FRINGE/ALT. It's not a concept I'm introducing. Please refer to that and use the criteria there, not your own.
From ALT: "Alternative theoretical formulations from within the scientific community are not pseudoscience, but part of the scientific process. They should not be classified as pseudoscience but should still be put into context with respect to the mainstream perspective."
Notably, the open letter is not WP:FRINGE/PS, because it is an example of a critical discourse, which PS does not have: "Pseudoscience usually relies on attacking mainstream scientific theories and methodology while lacking a critical discourse itself." What else is an open letter of dissent by members than critical discourse.
You also suggest above that Physicists are not within the relevant scientific discipline for there to be significance and relevance in their proceedings to this topic. I don't know of any specific WP criteria here, but the concepts of energy flux, light spectra, thermodynamics, properties of various phases of matter, etc. etc. are referenced in this article and core physics. I simply don't know what you're talking about. Please clarify.
The public statements of the American Physical Society on majority and minority views of their members is clearly both RS and ALT. Pablo Mayrgundter (talk) 21:55, 24 August 2023 (UTC)
Reliable sources on Wikipedia may include [..] That is a quote from WP:FRINGE, not WP:RS. A source is not "reliable" per se - it is reliable for certain things. For scientific subjects, we use scientific sources. Climate change is a scientific subject, not a fringe one, so, WP:RS is more relevant, especially WP:SCHOLARSHIP.
all majority and significant minority views Significant views within the relevant science. Climate change denial is negligible within climate science in 2023. Has been for decades. Your echo chamber tells you different, but that does not matter.
Alternative theoretical formulations from within the scientific community are not pseudoscience Climate change denial does not come "from within the scientific community". It comes from free-market think tanks. You should inform yourself about it before you try to propagandize it. Merchants of Doubt is a good starting point.
the concepts of energy flux, light spectra, thermodynamics, properties of various phases of matter, etc. etc. are referenced in this article and core physics This is becoming more and more ridiculous. The conflict between scientists and deniers is not about "concepts". It is about deniers claiming to find non-existent weaknesses in the science. Giaever, for example, is a specialist in superconductors. For that, you need a lab and a few gizmos. You combine them, and you try to find a way to make them do something they have not done before. The math you do is specific for quantum mechanics: solving the Schrödinger equation by finding the best approximations. Climate change is about analyzing huge sets of data from a chaotic system. The math you do is specific for chaos theory and for statistical inference. Those are totally different skill sets from what Giaever needed. Or Clauser. And so on. Those people do not come up with new objections to climate science - they just repeat what they read in the pro-free-market media, and that comes from the think tanks. Anybody without a degree can say the same thing those people say. --Hob Gadling (talk)
So, science does not work in the naive way you seem to ascribe to it, where you earn a degree and are a specialist for everything scientific, then earn a Nobel and are a sort of pope for everything scientific.
Can we stop this? Educating you about how science works is not the purpose of this page, but it is the correct response to your questions. --Hob Gadling (talk) 07:28, 25 August 2023 (UTC)
You should certainly stop. I don't appreciate being called naive or a propagandist.
Could anyone else comment here? I think there are constructive points to be made here for the benefit of the article. Pablo Mayrgundter (talk) 19:16, 26 August 2023 (UTC)
Hob Gadling has been patient enough to explain the policies of this site, which you should be familiar with since you have been a member of for 20 years. At some point, you have to take a hard look at yourself and ask yourself what it is you really want to accomplish. The evidence and your willingness to accept it is the difference between healthy skepticism and denial.
I can recommend a good book that I am writing an article about: it is called "Denying to the Grave". I think it might be quite appropriate, since it talks about climate change as well (among the massive quantity of evidence already present). Having said that, I second the closing of this discussion, which will lead nowhere and, again, does not make the talk page a forum.
It's not patient to call for shutting down discussion and engaging in name calling in reply to my first comment, the third from parent.
I'm still looking for some example of what qualifies as alternative theories, constructive criticism or "healthy skepticism", as you say, on this topic. If there is none, it's no longer science, and it's a gross distortion and politicization of where the actual science is.
The current article demonstrates none of this.
Compare these articles on topics in physics and biological evolution that have strong consensus, yet do note criticism:
All of these qualify the certainty of these theories by saying, noting problems, areas of incompleteness, or alternative approaches. This demonstrates my claim that this is actually how healthy science works.
In my humble opinion, it's incredible to hold a higher bar for "settled science"on climate change, and so censoring criticism, than what these theories do. I really don't understand how saying that is considered denialist propaganda. There is such a sorry state of discussion on this topic.
Please, exemplify or sketch what will be an agreeable form of criticism in this article for:
Hear me out, please, still with my goal of improving the Wiki _headlining_ article on ‘Climate change’. The point was made earlier in Pablo Mayrgundter's post that about 50% from US polling think contemporary climate change is human caused. That leaves half the country that does not subscribe, despite a phenomenon that Wikipedia’s article on ‘Climate change’ describes as close to settled science.
Stepping away from the science for the moment, may I offer a bigger picture view of this situation, from the standpoint of the layperson, many of whom turn to Wiki for education on this subject matter?
First, this whole phenomenon was introduced to the layperson some 30 years ago as ‘Global Warming’. A decade or so later, the authors decided to re-brand the movement as ‘Climate Change’. In reaction, the layperson wonders, “I thought this was all about global warming and the detrimental effects of the planet heating up? So does this mean we now have to be on guard against global cooling, too, and the adverse effects of the planet getting colder. I’m confused – Is the planet getting hotter or colder, and if only hotter, why aren’t we keeping the name ‘Global Warming’? – hmmm…”
Then the layperson hears in the news every few years about repeated predictions of the world ending if we don’t act immediately to combat climate change, only to see the forecasted dates come and go with no Armageddon.
Through all of this, the layperson is bombarded with reminders that the planet continues to heat up, and that we humans are the cause through our burning of fossil fuels. A casual observer of the discussion wonders, “Wait a minute! What about the Ice Ages? Since those ages are passed, we know that the ice melted, yet this occurred thousands of years ago, well before industrialized humans, so how was that even possible? Are you telling me that on the planet Earth, there are other forces besides industrialized humans that can cause global warming? If so, how do we know that contemporary global warming is not caused by those same forces?
In spite of this, the _headlining_ Climate change article by Wikipedia, probably the premier online source of knowledge on climate change for the layperson, has no discussion of these other factors.
So, in reviewing this brief 35-year history of the global warming (excuse me) climate change movement, is there any wonder that Americans are split in their thinking on the causes?
The purpose of this essay was not just to explain an example of what some would call climate denialism, but to propose a solution to Wikipedia. I urge Wiki to modify this _headlining_ article on ‘Climate change’ to introduce and explain these other factors. For instance, even if your reported science seems to implicate humans in causing global warming, why can’t contemporary climate change be caused by the same factors that triggered the Ice Ages? Take the reader through that journey of understanding.
I love Wikipedia. It can do a great service to the country/world by introducing balance to its _headlining_ article on Climate change. You will enhance your credibility by conceding those points that you can, and in so doing, switch some climate deniers to just disagree-ers or agnostics, and even convince yet others. Keplic (talk) 17:20, 20 August 2023 (UTC)
I think the main editorial issue is that encyclopedias present facts, rather than a "journey of understanding". Presenting misunderstandings, only to immediately refute them, gives the (many) misunderstandings a degree of emphasis that they don't deserve. (P.S. It was the George W. Bush administration that pushed the change in terminology from "GW" to "CC" because the latter sounded less threatening.) —RCraig09 (talk) 18:05, 20 August 2023 (UTC)
That was a long and irrelevant rant. The percentage of people in some some random country is not relevant to this article. It is the subject of other articles, such as Public opinion on climate change. The history is handled in History of climate change science. Stepping away from the science is something you can do somewhere else. Is it so difficult to understand that this article is about the science of climate change? Yes, there is also the bullshit of climate change, but that belongs somewhere else. It is pointless to chat and chat and chat and chat here about your desire to change the subject of the article. You are not convincing anyone.
If so, how do we know that contemporary global warming is not caused by those same forces? Go read the article. Go read the sources linked in the article. This page is for improving the article, not for educating people who have fallen for denialist propaganda. --Hob Gadling (talk) 19:53, 20 August 2023 (UTC)
For some reason this discussion has narrowed down to things within the USA. Obviously this is a global encyclopaedia, and climate change is a global issue. 50% of Americans is 2% of the world's population. What they think is as important (or unimportant) as what any other other 2% of the world's population thinks. (Nigeria, anyone?) And as someone who provided computer support to Australian climatologists working on climate change over 40 years ago (more than 35, OK?), I find this stuff about the name changing quite silly. Maybe it's part of denialism dogma. Right from the start, the work I observed was described as being about anthropogenic global warming leading to greater than average amounts of climate change. It was NEVER about one or the other it has always been both. US politics may have been different, but this is global. HiLo48 (talk) 01:10, 21 August 2023 (UTC)
I would point out that what you describe is a semantical argument in English language, and as the majority of native English speakers are in the US, it stands to reason that the discussion would focus heavily on the US. Crescent77 (talk) 04:07, 21 August 2023 (UTC)
No. Science is global. Climatology doesn't care what language you speak. Oh, and Australians are native English speakers too. HiLo48 (talk) 04:21, 21 August 2023 (UTC)
Lol, yes, but English speaking climatologists, and the general english speaking public, care what language you speak. So does the English language wikipedia. Crescent77 (talk) 04:38, 21 August 2023 (UTC)
You haven't worked in science, have you? HiLo48 (talk) 05:06, 21 August 2023 (UTC)
I do work in science. I encounter alot of scientists on WP who have trouble with WP's format, as they are often troubled that they do not receive special status for their knowledge here. The lede in your talk page is a pretty good illustration of that issue. Crescent77 (talk) 05:23, 21 August 2023 (UTC)
If they have trouble, they should not tell their acquaintances to make vague hints on the Talk pages of random articles but instead articulate their problems clearly at the proper place: pages like WP:Village pump (policy). If you want to rename the article, check the archives for earlier discussions and, if you have an argument that has not already been brought forward, start a new section with it. Are we finished here, or do you want to continue using this page for purposes it is not intended for? --Hob Gadling (talk) 06:24, 21 August 2023 (UTC)
but with the x-axes on a consistent scale. Such a graph will make it easy to compare historic and current changes. The graph will show that the speed of current changes is unprecedented.
Regarding "The graph will show that the speed of current changes is unprecedented."- that statement is inaccurate, see Abrupt climate change. The issues are numerous:
It is very hard to distinguish exactly how quickly temperature swings happen in the geologic record, especially the further back in time you go- decades vs thousands of years are often indistinguishable
There are dramatic events like asteroids hitting the Earth or supervolcanoes erupting that can cause extremely rapid temperature shifts
Prehistoric data is also smoothed and likely eliminates short term swings, especially the further back in time you go as we lose more detailed records such as tree rings and ice cores
What we can say (and do say in the section "Temperature records prior to global warming") is that we are driving temperatures to levels unseen since modern humans evolved.
Thank you. I agree with "we are driving temperatures to levels unseen since modern humans evolved."
Abrupt_climate_change describes "Changes recorded in the climate of Greenland at the end of the Younger Dryas, as measured by ice-cores, imply a sudden warming of +10 °C (+18 °F) within a timescale of a few years." Still, that +10 °C in Greenland dwarfs against recent +17-28 °C in Greenland.
Suggestion to make clear that "we are driving temperatures to levels unseen since modern humans evolved": Divide current text of "Observed temperature rise" into 2 subchapters: pre-human and human era. Add details about first humans and temperature rise at end of Younger Dryas.
pre human era (a rename of current chapter: Temperature records prior to global warming)
changes 500-50 million years ago, with the yellow margin in the graph
We don't want to expand the article much because it's already long and we already have several articles on temperature change prior to global warming. I would support expanding the first paragraph of the section "Temperature records prior to global warming" to be 2 paragraphs- one on human era, one on prehuman times. You want to take a crack at that? Efbrazil (talk) 19:14, 16 August 2023 (UTC)
Done. Did not add any text yet, just the graph. Restructured chapters, moved text. Uwappa (talk) 00:53, 17 August 2023 (UTC)
I reverted the edits for these reasons:
This is an article about global warming, not temperatures prior to global warming. We should be leading with the global warming temperature record, then put that in context second.
We have only 1 sentence on prehistoric temperatures, so dedicating a whole new section and graphic to that is not warranted.
The graphic you want to add is not legible in thumbnail view and crowds the existing graphics. All other graphics in this article are legible in thumbnail / smartphone view and are correctly spaced. This standard was part of bringing the article to FA status and should be maintained.
If you want the graphic added, I suggest you look to modify it so it is visible in thumbnail / smartphone view as has been done for other graphics in the article, then look to replace or move other graphics so there is room for the new graphic.
If you want more focus on prehistoric temperatures, I suggest breaking the first paragraph of that section into two paragraphs.
Thanks for bringing this up. Similar points have been discussed here on many an occassion, unfortunately a small of group of well intentioned but overly zealous gatekeepers continues to impede the progress of the article towards a more encyclopedic format, but continued constructive criticism has seemed to help. Crescent77 (talk) 04:15, 21 August 2023 (UTC)
"overly zealous gatekeepers"...Ah yes. Wasn't it Aristotle that once said... "When all else fails, try violating WP:CIV by using Ad hominem. That'll show'em." DN (talk) 04:15, 25 August 2023 (UTC)
The discussion above is closed. Please do not modify it. Subsequent comments should be made on the appropriate discussion page. No further edits should be made to this discussion.
More on economic impacts
based on current research i explained the impacts of climate change and on the mechanics of global economy. It was removed ( 18:59, 11 October 2023 RCraig09 ). Link to the main Article (Economic analysis of climate change) was removed as well.
The data and processes I described are necessary to understand the effects of climate change on global economy and society.
due to strong interests of certain companies I fear censorship. An ecyclopedia needs to express all aspects of the topic, including economics. WikiYeti (talk) 14:03, 12 October 2023 (UTC)
(partially copied from my User Talk page) @WikiYeti: I was not "censoring". I was following long-established consensus on the type of content that should be included in high-level articles such as Climate change. Your posts were unduly long, and of too-narrow scope for inclusion there. Read my edit comments here: if your posts were shortened to be more concise, some of that content might warrant inclusion in subsidiary articles, or within the proper subsection of Climate change (probably a subsection under "Impacts"). More generally, see WP:BRD. —RCraig09 (talk) 14:14, 12 October 2023 (UTC)
I agree with RCraig09. I believe we discussed this before and came to the conclusion that more concrete impacts (health, nutrition, water, displacement) each deserve as much attention as economic damages. Economic impact is now described under lifelihoods.
Please Wp:assume good faith. Do not (indirectly) accuse people of working for "certain companies". As I mentioned yesterday on your talk page, climate change is a contentious topic, so our policies on WP:civility are extra important. —Femke 🐦 (talk) 16:07, 12 October 2023 (UTC)
I do think a new section on economics makes sense, probably splitting the Impacts / Humans / Livelihoods section into 2 sections, one for "Economics" and another for "Displacement". A new paragraph on economics could be added as part of that.
I encourage you to make a proposal here first. What you may not have considered is that this article reached FA status and is high profile. That means editors want to review major changes before they take place, such as the addition of a new section. Also, as an overview article the overall length is already long and should not be extended by much, if at all.
Also, to make room, I'd be in favor of cutting back the "society" section, which over belabors the issue of climate change denial, and further is grossly biased as it simply ignores the issue of climate change alarmism. Efbrazil (talk) 16:15, 12 October 2023 (UTC)
It's funny how new people (I mean new to the WikiProject Climate Change) love to jump into the main climate change article to edit it rather than first helping out with relevant sub-articles which are in desperate need for improvement and fleshing out. Like, in this case, the article Economic analysis of climate change. Then, later, a sentence or two from that topic could possibly be brought back into the main article (if it's relevant for a high-level article and well sourced). EMsmile (talk) 16:44, 12 October 2023 (UTC)
@WikiYeti: We understand your eagerness to spread information about the effects of climate change. However, as suggested, it's best for new editors to propose large additions here, on the Talk Page. Your additions are much longer than needed to convey the essential information (they have too much background information, and read like an essay and not an encyclopedia article). Also, your additions don't necessarily fit in the places where you have inserted them. There are numerous grammatical, spelling, and language expression issues as well (I don't know if English is your native language). I have removed the "Security" and "Economy" sections, with the understanding that you can propose concise additions here, on the Talk Page. —RCraig09 (talk) 16:05, 15 October 2023 (UTC)
How about a narwal instead? Chidgk1 (talk) 18:56, 30 August 2023 (UTC)
I've never been a big fan of the polar bear pic (it seems tug-at-your-heartstrings and somewhat simplistic, for an adult encyclopedia article), but a study published on 31 August supports an inverse correlation between GHG emissions and polar bear reproduction and survival. CNN article. —RCraig09 (talk) 15:17, 3 September 2023 (UTC)
But... see Adkins, Frankie (13 November 2023) "Why polar bears are no longer the poster image of climate change" BBC News. —RCraig09 (talk) 05:32, 15 November 2023 (UTC)
Copyright considerations
(broken out from above section, "Impact of climate change on food production")
Dear @Uwappa, the image you created seems excellent to me (but it's not clear to me where you recovered the data from). Yesterday I tried to upload the image I had prepared, extracting it from the video, but I didn't understand why I couldn't upload it. I made an animated GIF that I think is quite impressive, although I think it could be improved. Now I'll try to upload the image again. Thank you Aftershock81 (talk) 12:00, 16 November 2023 (UTC)
@Aftershock81: Wikipedia and Wikimedia do not generally allow people to upload works that are subject to copyright (with some exceptions). It is generally permissible to generate your own graphics using published data, because the data itself is not usually protected by copyright. —RCraig09 (talk) 17:02, 16 November 2023 (UTC)
Thanks so much @RCraig09, for clarifying this for me. In this case, I created the image, taking the frames from a video published on Youtube. No copyright is indicated for this video. So, is the GIF file I'm trying to upload allowed or not? Aftershock81 (talk) 17:41, 16 November 2023 (UTC)
safe alternative: link to figure 6: https://www.mdpi.com/2071-1050/15/19/14235#sec4dot1dot3-sustainability-15-14235 Uwappa (talk) 17:45, 16 November 2023 (UTC)
@Uwappa, this is a great idea! Thank you Aftershock81 (talk) 18:46, 16 November 2023 (UTC)
RCraig09, please have a look at: https://www.mdpi.com/about/openaccess
Is it OK to quote any part of https://www.mdpi.com/2071-1050/15/19/14235 ?
Would it be OK to upload https://www.mdpi.com/sustainability/sustainability-15-14235/article_deploy/html/images/sustainability-15-14235-g006-550.jpg ?
My understanding (informally): Wikimedia Commons allows things to be uploaded if covered by a Creative Commons license, and I'm not sure if the "Open Access" is enough. I suspect not, because the https://www.mdpi.com/about/openaccess page mentions, "For articles published under an open access Creative Common CC BY license,..."—which implies that some articles are not under CC license. It's safest to take the data and create your own graphic (which, though it's extra work, is often a good idea for reasons other than copyright). Some sources make very simple charts of data, requiring no creative originality—and those simple non-creative charts can usually be used, because to prohibit their use would be the same as prohibiting use of the data (which they should not do). One big exception is that many works created by US government employees in the performance of their duties can be freely used, since US government works are usually considered to be in the public domain. Re your "quote" question: it's safest to put sources' textual content into your own words rather than literally quoting (copying) from sources, though direct quotes can be used if enclosed within "quotation marks". The basic idea for both graphics and text is to not use, without permission, content having more than a "modicum of originality". For more authoritative discussion, see Wikipedia:Copyrights. —RCraig09 (talk) 18:36, 16 November 2023 (UTC)
Thanks so much @RCraig09. In the case we are talking about, this article is certainly open access. This is indicated above the paper title, top left. Some journals, for example Public Health (by Elsevier), are mixed, i.e., some articles are open access and others are not. The Journal Sustainability (which I know well because I downloaded some publications from there) is full open access; all items are. Aftershock81 (talk) 19:02, 16 November 2023 (UTC)
Re the question re taking frames from a YouTube video: works are assumed not to be free use, and taking frames from a copyright-protected video is almost certainly just as much a copyright violation as taking the entire video. There are rare exceptions, such as "Fair use" under US law (see Wikipedia:Non-free content). —RCraig09 (talk) 18:40, 16 November 2023 (UTC)
@RCraig09, thanks. Actually, I really liked the video and thought it would be very illustrative to share. However, I understand that it is complicated both to share the entire video and to share GIF images extracted from the video. So, the simplest solution might be to create the most interesting graphs myself. The article mentioned contains links to the data sets used. I have Excel sheets ready for calculating climate indices and other statistical calculations. In theory, it takes me little time to create a good graph (at least a starting draft). The doubt that comes to me, however, is whether the diagram is considered reliable. In other words, the article we are talking about is considered reliable for the purposes of publication on Wikipedia. But would a diagram created by me be considered equally reliable? Sorry for the many questions. Thank you. Aftershock81 (talk) 19:21, 16 November 2023 (UTC)
As long as you carefully document where you got the data from (direct links to source, with explanation), it is acceptable to make your own charts. I highly recommend using the "upload wizard" on Wikimedia Commons, which prompts you for sourcing for the data. The sourcing should be on Commons' file description page for all to see. You can only claim the graphic is "Own work" if the graphic is literally created by you; otherwise, the source must be stated with demonstration of licensing or legally implied licensing. When the graphic is subsequently included in a Wikipedia article, your caption should include sourcing for the data (advice: use the "Cite... Template" at the top of the edit box). —RCraig09 (talk) 19:35, 16 November 2023 (UTC)
Impact of climate change on food production
I have fonud this GIF image, extracted from the following video (link: https://www.youtube.com/watch?v=UROcf82c5qM), which briefly summarizes how the correlation between climate oscillations and fluctuations in agricultural production has increased over the last 60 years in central Italy. I think it could be illustrative if included in the Impacts - Food and health section.
File:Impact of climate change.gif
Cheers Aftershock81 (talk) 15:03, 12 November 2023 (UTC)
I think it's an interesting concept, but this GIF's small size, small font size, complexity, detail, and speed of presentation make it difficult to comprehend, especially in the context of this already-long high-level article. But thanks for your interest. —RCraig09 (talk) 19:32, 12 November 2023 (UTC)
Thank you, @RCraig09 Aftershock81 (talk) 21:10, 12 November 2023 (UTC)
The graph from 0:15 to 0:19 is nice as a summary of a changing climate:
Thanks @Uwappa , that sounds like a great idea. I want to try extracting images from the video and see what can be done. Aftershock81 (talk) 21:17, 12 November 2023 (UTC)
@Aftershock81 and Uwappa: In the interests of saving you time and effort, I think the idea of a migrating polygon is something that would require an explanation that's too long for most readers of a layman's encyclopedia. Based on my past experience with this editing community, I think that "new" graphics of substantial complexity would not be supported for inclusion in articles. That's why there has been more support for Warming stripes (immediately intuitive) than Climate spirals (harder for laymen to quickly appreciate). I'd hate to see you spend hours generating a cool graphic that's overly sophisticated for the audience, especially in a general, high-level article such as this. I'm not discouraging creativity, but Wikipedia by nature tends to be a follower and not a leader. —RCraig09 (talk) 21:29, 12 November 2023 (UTC)
Prego! (You are welcome) Some afterthoughts:
The video fragment 15-19s answers your question, shows a kind of Goldilocks_zones for agriculture, with enough recipitation and a suitable temperature range.
swap the x and y axis, put temperature on the Y axis. A warming climate goes up, a cooler down. A dryer climate will go left, a wetter climate goes right.
do not fill a polygon, use a simple Scatter_plot, connect 12 dots of one year
the chart background shows shades of green (suitable), yellow (danger) and red (impossible).
See proof of concept to the right. The simple example shows 2 years of a place with a climate that gets warmer, same precipitation. The recent summer is too hot, touching red in the left hand top corner. Old winters are too cold, recent winters are just OK.
A desert climate will be in the red area, not enough water to grow food in any month. This will apply to the climate north of Goyder's_Line in South Australia, the Sahara, etc.
For Mediterranean countries like Spain and Italy, where the climate gets hotter and dryer, it will show the current dry springs and hot summers are probably already in the yellow or red zone, a climate heading for desertification.
For cold countries like Norway and Finland, it will show increasing possibilities for agriculture in spring and summer.
You've done a great job of reducing a lot of data from the video, into something that's more directly understandable. (a) I'm assuming the final version would have some legends inside the graphic, such as small-font abbreviations for the months. Such legends would make it unnecessary to rely on future editors from explaining the chart in the textual caption. (b) Separately, I'm worried about where this chart could be inserted, as it concerns only one region in Italy, probably Climate of Italy but not in higher-level climate change articles. (c) A technical issue is that the shape of the two curves is very similar, so that the chart doesn't seem to reveal temperature (as a dependent variable) varies differently as a function of precipitation; it only shows progression of temperature over years (time is not shown at all), without showing the relevance of precipitation (as an independent variable). —RCraig09 (talk) 17:40, 13 November 2023 (UTC)
Thank you. Yes, the Italian graph is a gem. It requires a bit of polishing, but the analysis and design concept are good, very good. The graph struck me. Wow, this is a graph that can show the impact of climate change at a personal level, unlike any other climate change graph I know.
I was and still am in doubt about the month abbreviations. And when in doubt, leave it out. The Italian original has numbers 1-12 which is language independent but those numbers were not immediately clear to me. It think month labels will be messy when many years overlap, like in a climate spiral. To me it is obvious that this is a chart for a place in the northern hemisphere, with the coldest months at the start and end of the year. So the 2 coldest months at the bottom must be Jan and Feb. Months go round clockwise from there, with Jul and Aug being the warmest months after which it gets colder until the year ends in Dec.
Yes, these charts should be at location specific pages, e.g. Climate_change_in_Italy, Climate_change_in_Nevada, etc. For laymen I think the chart is easy enough. They will be mostly interested in their own climate at their own location of which they will know their own climate. They will know which months are hot and cold, they will know which months are dry and which ones are wet. The graph will make climate change personal: is my climate heading towards a red zone? Is climate change a thread for agriculture in my area? Such a personalised message is very powerful: Climate change will impact you too! Will a version with global averages be useful for a general page? Maybe.
Yes, well spotted, the shape of the two curves is similar, because... I followed your advice and minimised my research time by copying some other Mediterranean min max temperatures and single set of mm rain as fake but quite realistic climate data, good enough for the proof of concept. Yes, in a real graph with real data the curves will be more different. Italy now suffers from droughts, so recent curves will be more to the dry left. Recent summers in NW Europe will be wetter, move right.
Time is shown in a way similar to a climate spiral, months going round and years having colours blue -> red. In a real graph with real data I expect something similar to climate spirals like , hard to distinguish individual years, but great to see the big picture, from old to recent. It may be better to cut down the number of curves, show decade averages. For the proof of concept a year legend would distract, make the fake data look too real, so I left it out, just like the location.
These graphs should be easy to make, by local Wikipedians, no graphic tool required, something as easy as Template:Climate_chart/doc with for each point:
year-month,
average temp,
mm precipitation.
No need for any green, yellow red background parameters as the Goldilocks_zone limits for agriculture will be the same world wide. Uwappa (talk) 20:31, 13 November 2023 (UTC)
I am not too sure about this graph. To me it still looks a bit complicated. Maybe it would fit better at effects of climate change on agriculture. That article was recently worked on by User:InformationToKnowledge and the take home message is: it's complicated. And unlikely that climate change would result in global food shortages in the forseeable future. EMsmile (talk) 20:56, 13 November 2023 (UTC)
Done:
coloured dots for months
legends for months and years
different mm rain for old year in spring and summer
When things are complicated: simplify. George_Goyder used only one variable, one value, 250 mm annual rainfall for his Goyder's_Line. His line proved amazingly accurate for agriculture feasibility. Outside of South Australia very few people know about Goyder's line. A global version of Goyder's line will probably work amazingly well in any area with similar temperatures.
A bit more complex but still simple: Create a similar graph background with green, yellow, red. Simplify temperature to an annual average. Add connected dots for cities. Where was a city 30, 20, 10 years ago? Where is it now? Is it heading to red? Uwappa (talk) 10:35, 14 November 2023 (UTC)
@Uwappa What you talking about for cities already more-or-less exists. If you check out this tool, it tells you about the most likely way cities' temperatures will change in 30 years' time. I have already tried adding information from it to every relevant city's page at the start of the year, but this ran into resistance from a certain editor, and then I discovered that the tool appears to provide self-contradictory results for certain cities. See this archived discussion on FTN to understand.
Effectively, if we want to use this tool across the wiki (and some days, I think it would be almost criminal to avoid sharing the insights it provides) we would need to have someone officially contact the scientists who wrote the paper it's based on, and ask them to check out what causes the issue with certain cities. Once they fix it, I hope there would be no more opposition on formalist grounds like what you could see in that thread.
As for Goyder's Line, it had certainly been an incredible achievement for its time, but one of the very things which makes climate change so complicated is that it tends to change the difference between rainfall events more than the annual average rainfall - at worst, it leads to those infamous cases where seemingly the same "average" turns into days of hard, land-eroding rain following months of drought. Effects of climate change on the water cycle should describe that already, but I didn't look at it very closely, and I think it needs quite a bit of updating. There is also my recent work on effects of climate change on agriculture, which does have some maps you might like. InformationToKnowledge (talk) 16:48, 25 November 2023 (UTC)
I just want to clarify this point a little further: there isn't really any doubt that climate change can cause unprecendented extreme weather events which inevitably ruin crops when they occur (although strictly speaking, the scientific definition of large-scale "crop failure" appears to be >10%, rather than the kind of total wipeout some may imagine), which inevitably leads to price spikes and yes, shortages. There is also isn't much doubt that in the medium-to-long-term, global climate will become less suitable for many crops (although there are notable exceptions which get to benefit globally: i.e., wheat is more likely than not to be one).
What there isn't any hard evidence for, however, is that either of those adverse factors would be able to overwhelm the human ability to both improve agricultural practices, particularly when many places still have a lot of room to grow, and to simply perform agricultural expansion if it comes down to that. This is why while there are certainly projections of increased malnutrition in the foreseeable future under some climate change scenarios, they do not really translate to predictions of mass mortality.
Thank you. I've checked out the tool at https://hooge104.shinyapps.io/future_cities_app/ That is an impressive tool with local temperature predictions.
What I am suggesting is more basic, adding background colour to a Péguy climograph:
pre-cooked simple graphs, no interaction required. Any Wikipedian could add such a graph to a local climate page by specifying chart data in way similar to Template:Climate_chart/doc. The data could come from any source.
The chart background would show a kind of "Goyder's area", a green zone with ranges for temperature and monthly rain fall suitable for agriculture. Months of droughts will be in the red zone, for instance the warmest, driest summer months.
The diagram could show future years, but there is no need to do so. When you see months move through yellow, the next colour is obvious. See hot summer and cold winter months in the prototype.
Diagrams could help to adjudicate: will agriculture be viable in my local area? Are months moving in or out of the green zone?
The shown diagram is just a design idea, a prototype. So please do not add it to any page. I would appreciate support to get a template programmed for this chart. Uwappa (talk) 13:58, 26 November 2023 (UTC)
Though some editors think GIFs are distracting, they have the advantage of allowing people to look at a single trace at a time. A before-and-after GIF might make the change more easily perceived. —RCraig09 (talk) 21:42, 13 November 2023 (UTC)
Do you mean an animated GIF like ? That would take us back to the Italian video fragment, visually appealing, impressive show during a presentation but a burden for short term memory. See the past, but not yet the current. See the current, but not the past anymore. The proposed alternative is to show a range of years, past and present in one graphic. Uwappa (talk) 08:57, 14 November 2023 (UTC)
Focus on long term for climate change. Show decades, not years. The result will be a limited number of curves, e.g. 5 for the past 50 years, or 10 for the last century.
Use transparencies for age, old decades very transparent, in the background, like a fainting history. More recent decades on top, less transparent, with the latest decade a little bit transparent, in the foreground.
The result will be just one picture, one frame that still shows movement: where is the climate going to? E.g. are summers in a yellow danger zone, approaching red?
Done, I think it will look good when using 5 or 10 curves. The dots for months were sucking away attention, took them out, will have to puzzle about those and legends again.
Dear all, I now realize that the discussion here has continued. I'll show you what I was able to do after downloading the video and manipulating it.
From your discussion I see that you expected something different. Regarding what @Uwappa proposed, keep in mind that to create the diagram from scratch, you would need to have the work data available (in numerical format), which we don't have. I tried putting the two images side by side in the GIF and making the evolution quite slow, in order to obtain a good graphic rendering. As regards the observations of @RCraig09 and @EMsmile, about the first figure I proposed, I agree; those animated diagrams are too complicated to provide an immediate idea. This is a shame, since that kind of analysis is very interesting and innovative (I only found it done that way in that work). At this point, perhaps it would be more useful to provide the link to the study directly (it is indicated in the comment on the video; link: DOI:10.3390/su151914235), so anyone interested can go and read it. This discussion has become fruitful and purposeful. Thanks everyone for the suggestions. Aftershock81 (talk) 12:36, 15 November 2023 (UTC)
Link: https://doi.org/10.3390/su151914235 Uwappa (talk) 12:46, 15 November 2023 (UTC)
Klimogramm
[In figure 6 the diagrams are called "Péguy climographs".]
The English article Climograph does not mention these diagrams. The German and French wikipedia have a dedicated article:
There are different kinds of climogram, both diagrams showing precipitation and temperatures on the ordinate with time on the abscissa, and diagrams of precipitation vs. temperatures. Peguy graphs follow a standard format, which reports precipitation on the ordinate and temperatures on the abscissa, in which the four sectors are conventionally identifed: temperate, cold, hot, arid. Aftershock81 (talk) 12:25, 16 November 2023 (UTC)
Grazie mille, thank you so much. So, a Peguy graph is a standard diagram with a well defined format. Should we create a Peguy graph article in the English Wikipedia?
Is this interpretation correct:
temperate, warm
suitable for agriculture, food production
cold, arid
not suitable for agriculture, too cold or too dry for food production.
The border between temperate and warm looks like a food production limit. But is it really? Warm seems like the tropics, warm and wet, where food production is easy, plentiful with products like rice, palm trees, tropical fruits.
Are the boundaries of the triangle well defined? Are those boundaries the same world wide?
Shall I update my design so it complies with the standard: x=temp, y=precipitation? Should warm be 'green'? Uwappa (talk) 20:40, 16 November 2023 (UTC)
Hi @Uwappa, I'll try to answer. In the Peguy diagram the vertices of the triangle have standard coordinates. Now I don't remember the values, but I remember that I had read them somewhere in the article shared above. As far as climates are concerned, clearly, the Mediterranean and the tropical ones are the most favorable for the growth of plants. The problem, however, is not the kind of climate that exists in a specific geographical area (e.g., hot, humid, arid, etc.) but is the shift towards a different climatic condition. In other words, each climate has its own agricultural production (by way of example, the Mediterranean climate is favorable for grape or olive, the arid one is favorable for prickly pears, pistachios, pepper and other spices) but the climate shift can put in crisis, productions rooted in a geographical area. For example, Abruzzo is a major national producer of grapes and wine. A climate shift from Mediterranean to arid, may put into crisis the entire wine industry in the region. Aftershock81 (talk) 11:59, 18 November 2023 (UTC)
"A climate shift from Mediterranean to arid, may put into crisis the entire wine industry in the region."
Exactly. That is a major impact and it is happening fast, within one or two generations the rooted wine tradition may not be fruitful anymore. Or even faster, in just a few years like in Spain. The flip side of the coin: the new climate may benefit a future pistachio industry of which no local tradition exists yet.
A Péguy climograph could show green zones for olives, wine grapes, prickly pears, pistachios and peppers, with curves for the old and the new local climate on top. Farmers will be able to see: which products suit the new climate? Which product green zone surrounds the new climate curve?
Farmers can decide what to do before disaster strikes:
Move to cool Norway to make wine?
Stay in Italy and switch to pistachios?
Give up agriculture all together, switch to sheep farming?
Again, thank you so much for sharing the video fragment with that diagram of temperature and precipitation. See 20:31, 13 November 2023 above for a proposal to let local wikipedians feed the new design with local, real climate data. I've updated the design with data, going left, heading for an arid climate.
A climate-change diagram can have many applications.
In your video fragment you can see July and August falling into the Arid zone. Farmers could see they are heading towards red and try moving back to green using irrigation or move to another location before farming at their current location becomes unfeasible.
The green zone could show comfort zones of plants. E.g. what is a suitable temperature-rain range for cabbage, apples, wheat, grapes, oranges, dates, mayaka? Farmers could anticipate, switch to a crop that suits their new climate.
I don't think this is true? Switching to sources which don't release greenhouse gases would also reduce emissions. Endwise (talk) 07:56, 30 November 2023 (UTC)
You mean in the lead? That's just a fragment of a sentence. The full sentence is this, which is correct: "Reducing emissions requires reducing energy use or using low-carbon sources rather than burning fossil fuels." Efbrazil (talk) 23:20, 30 November 2023 (UTC)
Revised Numbers from ESSD for Global GHG Emissions
The June 2023 ESSD Indicators of Global Climate Change 2022 report on pp.2298-2230 indicates a significantly lower amount of global GHG emissions (55 vs 59 Gt) compared to the current values shown in the article, which are from AR6 WGIII. The ESSD authors seem to have very meticulously described the differences in accounting methods between their work and the AR 6WGIII report, with the implication being that their figure is an improved estimate. I think we should consider posting that revised figure for 2021 of 55 GtCO2e, but wonder -what do others think? It's a fairly significant difference. Femke? Dtetta (talk) 05:44, 26 October 2023 (UTC)
Yeah, those are the top scientists doing this type of work, so definitely an improvement over what we have now. I'm not quite convinced we need to show that number in the article however, as it's inside baseball. Even as a climate mitigation researcher, these numbers don't say that much to me. —Femke 🐦 (talk) 16:12, 26 October 2023 (UTC)
Understand - One thing to consider is that the report by this group (as I understand it) is now considered something of a “technical reference” for the COPs, so it might be nice to have the WP article consistent with that, since I believe WP is also considered a reference (to some extent) in those talks. But I agree the absolute numbers themselves don’t have as much meaning as, say, the trends, and whether we will be seeing declines in emissions soon. Dtetta (talk) 16:31, 26 October 2023 (UTC)
Revise “Physical Drivers of Climate Change” (ERF) graphic”?
I’d also like to suggest that we revise the current "Physical drivers of climate change" graphic with an adapted version of Figure 2a (p. 2305) in the ESSD paper. I think there are several advantages to adapting that graphic to replace the current one.
It’s more current and based on improved information.
Grouping aerosols into one row seems an improvement, as does showing one row for other well-mixed GHGs. One change that might be worthwhile would be to list the halogens separately, given the text currently devoted to the effect of the Montreal Protocol.
The positive ERF ERF associated with tropospheric ozone seems more clear.
Their treatment of albedo provides a nice distinction between the negative ERF of land-use along with the positive ERF of black carbon. IMO this integrates better with the text of the article.
I like showing the total anthropogenic ERF, which has increased significantly from AR6 estimates, although I’m guessing others don’t, which is why it’s not in the current graphic, despite being in earlier IPCC reports. That value (and it's increase over time) seems to be a key factor in the "Human and natural drivers" line in the "Global surface temperature" graphic in the lead, which is a connection I find a little hard to make in the current article.
I think we could avoid including the current positive solar ERF in ESSD Figure 2a, since the text itself clarifies that this is a single year estimate, and that the overall post 1750 solar ERF is minimal. I think we can also ignore the specific ERF values given to the right of the graphic, as we do in the current graphic in the article.
On a related note, we need to be clearer on the historical effect of periodic volcanic eruptions post 1750, as shown in Fig 2b and in AR6. In the second paragraph of the "Solar and volcanic activity" subsection, we make contradictory statements. The first sentence states that these have been the largest natural forcing in the industrial era. The fourth sentence seems to be stating the opposite.
Thoughts? Dtetta (talk) 03:18, 30 October 2023 (UTC)
Curious to see Ozone called out so prominently, whereas the IPCC does not include that at all. It's also not clear why water vapor is separated out, as presumably that's a feedback and not a driver. Perhaps the ESSD graphic is showing overall changes in the climate system rather than drivers of climate change (so they are including feedbacks).
In general, the current graphic is a high profile SPM graphic from the IPCC, not buried on page 2305 somewhere, and I prefer using the higher profile summary graphics as they've had more eyes on them. We'd also have a lot of work to boil down the ESSD graphic while maintaining font sizes and clarity.
As for other issues, the existing graphic separates methane, which is important as it's clearly the second most important gas, really weird that the ESSD aggregated that into well mixed gases. I also don't see a significant advantage in grouping aerosols. At best, replacement would be a wash as I see it, so I vote no. Efbrazil (talk) 18:04, 1 November 2023 (UTC)
AR6 WG1 does in fact mention the ERF of ozone on page TS 36. From my readings, ozone is treated differently than most other GHGs, given the extent to which it’s a short term gas and so does not fit into the well mixed category, which is why ESSD lists it separately.
This graph not buried somewhere. It’s simply one page in a 32 page article, the pagination being used is like in many journals - it does not mean that this is some 2,400 page report. I don’t think the IPCC graphic is any easier to spot than this the ESSD one if you look at each report/paper in it’s entirety.
Re: the number of eyes that have looked at the ESSD graph, I suspect there’s a lot of peer review that goes into the ESSD annual reports, which I believe are considered authoritative international assessments, similar to the IPCC reports. I think many of these authors are also involved in the IPCC reporting. These reports may not be quite as extensively reviewed as IPCC reports, but they have the advantage of being more current. The authors note that there have been significant changes in IPCC ERF estimates between successive reports, so in that sense more current figures are better.
I think the whatever graphic is used here could do more to support the text, or at least clearly identify the main ERF factors. The greenhouse gases as ERF factors are listed, but not much else (the aerosol list doesn’t really jibe with the article text). Maybe the details in this graphic aren’t all that important to show, and it's not even needed. I think we would be better off with simply using figure SPM 2b as the graphic rather than the current figure, which is pretty much taken from figure SPM 2c. For me 2b does a better job of depicting the main factors presented in the text (GHGs, other human drivers, and natural causes). And the ESSD graphic does an even better job of supporting the various themes, including solar and ozone.
Since there doesn’t seem to be any interest in revising this graphic - would folks be opposed to me recreating the ESSD graphic? I would probably not do this on my own, but am thinking of trying to recruit a local high school student with graphic skills who has an interest in climate change.
Request: Can someone provide a link to the specific ESSD document? Thanks. (I can do the graphics if needed... no need to recruit a high school student!) —RCraig09 (talk) 04:07, 28 November 2023 (UTC)
Here you go - it was included in my original 26 October post to this section. https://essd.copernicus.org/articles/15/2295/2023/essd-15-2295-2023.pdf Dtetta (talk) 06:27, 28 November 2023 (UTC)
Merci (I was thrown off by reference to "pp.2298-2230"). I assume this discussion refers to Fig 2(a) on p. "2305". If you come to a specific consensus, I'm willing to do the graphic... maybe almost as well as a high school student! —RCraig09 (talk) 06:44, 28 November 2023 (UTC)
Thanks for the offer RCraig09:) Would be interested in your thoughts regarding the merits in this discussion as well. So far it’s just me and Efbrazil. Dtetta (talk) 14:41, 28 November 2023 (UTC)
There are several competing rationales above, and it seems that the decision on which graphic to include boils down to which rationale to choose. Bottomline: assuming the IPCC and ESSD are comparably reliable, I'd favor the most recent (ESSD) graphic as being most up-do-date and presumably created with prior knowledge of the earlier (IPCC) chart. Details of which elements to include are debatable, but I tend to be inclusionist in this regard: include 'em all! I can work out minor issues like font size and arrangement. —RCraig09 (talk) 20:53, 28 November 2023 (UTC)
Just trying to put this to bed. Does it make sense for RCraig09 to try to replace the current “Physical Drivers of Climate Change” graphic with the one from the ESSD paper? As he points out, there are a variety of ways of looking at this. IMO the current graphic does highlight the role of GHGs, aerosols, and albedo - but it misses ozone, doesn’t give a good sense of human vs natural causes, and is somewhat incongruous with some of the text. It seems like RCraig09 and I are in favor of changing the graphic, and Efbrazil would prefer keeping it. EMsmile - it was hard to tell from your comments where you stood on this - do you have a preference? Clayoquot and Femke - any thoughts? Others? Dtetta (talk) 15:57, 6 December 2023 (UTC)
I guess another question is whether we want to mention stratospheric/tropospheric ozone in the text itself. Dtetta (talk) 16:07, 6 December 2023 (UTC)
To avoid duplicated effort, be aware: I'm within an hour of uploading a new Radiative forcing / Physical drivers chart based on the ESSD data. —RCraig09 (talk) 16:30, 6 December 2023 (UTC)
Great-thanks! Dtetta (talk) 17:11, 6 December 2023 (UTC)
Thanks for the ping. I cannot make heads or tails of this discussion unfortunately. Could someone please put the graphics you are trying to choose from on this talk page? Clayoquot (talk | contribs) 17:44, 6 December 2023 (UTC)
The new 6 Dec graphic breaks out the GHGs, breaks out albedo (I think I'll add a footnote-like explanatory legend at bottom), and includes solar because some deniers think it's the sun that's causing GW (!). I've de-emphasized the confidence interval bars, and instead used gradient colors to be friendlier for our non-techy audience. I can add dots along the confidence bars to denote the best estimates, if you think that's important. I'm not sure if ozone is properly called a greenhouse gas per se; I can change if needed. —RCraig09 (talk) 17:57, 6 December 2023 (UTC)
Option C: ESSD Figure 2a
Thanks! Here is the original graphic from the ESSD paper. I can see pros and cons for all three. WIll comment in more detail later today. Clayoquot (talk | contribs) 18:30, 6 December 2023 (UTC)
The ESSD paper doesn't have it in degrees celsius then? Easier unit to understand. —Femke 🐦 (talk) 20:50, 6 December 2023 (UTC)
(I just added Option A, B, and C labels to the graphics).
- I find Option A easiest to understand. Showing degrees of warming rather than W/sq metre is more intuitive. In Option B, I understand the argument for having "Total anthropogenic" as a bar but it adds complexity. I understand the point of including "Solar" but (before looking it up) I do not understand what the word "Solar" by itself means in this context. Usually "Solar" by itself means solar electricity generation.
- In Option B, I really like the fade-out to represent uncertainty.
- Having a bar for contrails and aviation-induced cirrus is critical. The magnitude of this problem is a relatively recent discovery that the public under-appreciates, and it's role is expected to grow.
- In Option B, I have a lot of questions about the category of "Albedo (particles)". Is this where the warming from contrails went? If yes, I don't think it is correct to call it albedo. I am struggling to understand what kinds of particles this is referring to.
- For all options, it should made clearer that the graph refers to cumulative effects. Contrails, for instance, are a bigger contributor now than they have been historically.
- Overall I prefer Option A, then C. Clayoquot (talk | contribs) 00:49, 7 December 2023 (UTC)
Some explanations: In Options B and C, it's definitely total human-caused and not natural+human-caused. Any questions as to what Option B means (albedo entries, etc), can be understood by looking at Option C; I did some abbreviating of Option C to form Option B, which has apparently caused some confusion. I can change "solar" to "solar energy" or "sunlight", to clarify what's in Option C. I excluded contrails as it was such a small contributor, but it can be added in anticipation of it possibly becoming more dominant. I don't know if there's a linear conversion between W/m2 and °C, but especially for a lay audience the units don't matter as much as the realization that GHGs are the main drivers, and the total human contribution dwarfs solar influence. —RCraig09 (talk) 02:41, 7 December 2023 (UTC)
Agree with Femke, impact in Celcius (A) is easier to understand.
For option B: put the range in the vertical middle of the bar, as done in A and C.
Option B has 4 ways to group: A { and text colour for GH gases, () to split Albedo and 'total' for human caused. Please select one and stick to it.
Option C (page 11 of the PDF) visually gives the false impression that only Methane, Nitrous oxide and Halogens add up.
A, B and C lack a visual connection between total and parts.
Show, don't tell. Let the graphic show that all drivers add up. A stacked bar is hard with the ranges, but it can be done similar to a Gantt_chart where parts add up in time.
Keep each driver on a new line, but let a driver start horizontally where the previous one ended, similar to a finish-to-start in a Gantt chart.
No bar for human caused total, just the range will do.
Sort drivers by impact, Aerosols, Albedo, ... Ozone, CO2.
The result will be a C shaped graph. Uwappa (talk) 11:32, 7 December 2023 (UTC)
Simple alternative:
y-axis: impact in Celcius
x-axis: drivers, sorted big to small, negative ones at the end
Thanks so much for that great job with the graphic,RCraig09, and for your thorough explanation of the nuances involved with how this information is presented. Also thanks to folks who have contributed to the discussion.
Regarding degrees Celsius versus ERF, I agree with RCraig09 that the relative size of the various contributors is what people will look at, rather than drawing down and seeing what the X axis value/unit is per se. But it would be nicer if that axis showed centigrade rather than ERF. Re: the ERF-temperature relationship itself, my understanding is that total global temperature change scales roughly linearly with total net forcing, and that climate sensitivity expresses/determines that general ratio. I imagine the IPCC authors used some ratio number for constructing their charts in SPM 2, but I have not been able to figure out what that exact ratio they used is. Probably best if Femke confirms this.
Regarding Clayoquot’s question on the aerosol particles category, I believe that’s black carbon. And it might be easiest in the option B graphic to just label it that way, since that’s how we talk about it in the text.
It would be nice to add contrails to the graph, as Clayoquot suggests, but if in fact they are an increasingly important and critical category, I think it would be more important to have a brief mention of that in the text itself. I don’t see contrails discussed there.
Version 2 of Option 2 B is uploaded (17:25, 7 Dec 2023). I've explained albedo in a "footnote", simplified description of the horizontal axis, and further de-emphasized the confidence interval bars—all for our predominantly non-techy reading audience. I haven't yet added contrails because, frankly, it's a lot of work that may go to waste if this chart isn't used. I haven't changed to offset-stacking because it complicates the chart and makes comparisons harder. —RCraig09 (talk) 17:33, 7 December 2023 (UTC)
Craig, I'm not sure what problem you are trying to solve here. The IPCC SPM graphic is extremely high profile so it has been fully vetted and still represents best science. The version we have renders well on smartphone / thumbnail, is vector, is accessible, and is globalized. Any reduction in font sizes relative to width is a clear step backwards. Given the ocean of text above I don't even know what's being proposed at this point. This whole exercise strikes me as a solution in search of a problem. Efbrazil (talk) 17:55, 7 December 2023 (UTC)
I agree that some editors have expanded the discussion with digressions, asides, and alternatives. Originally, I pursued the ESSD version in response to Dtetta's original (03:18, 30 Oct 2023) post far, far above. I have clarified the new graphic in response to pertinent suggestions (only footnotes and W/m2 are small text), and was hoping discussion would converge. —RCraig09 (talk) 19:16, 7 December 2023 (UTC)
Yep, the classic problem of extensive discussion obscuring clarity. I'm just confused at this point as to what's being proposed and why. Like I searched on "Option 2" and don't see that anywhere. If you're not replacing the graphic I made anymore then all good, but otherwise I have concerns. Efbrazil (talk) 21:30, 7 December 2023 (UTC)
Oops, I meant Option B (not "2"), which is not too far above. Option C (source) is the basis for my Option B. User:Dtetta seemed to favor a graphic based on Option C; maybe we should wait for his more specific reasoning. —RCraig09 (talk) 21:45, 7 December 2023 (UTC)
RCraig09 - thanks again for all of your great work on this! IMO the graphic you created (Option B) is an excellent substitute for the current graphic. It better supports the text, is more visually appealing, provides a more complete and balanced presentation of the major drivers, and illustrates an important distinction between human and natural causes. I prefer your modifications (Option B) to just going with the original ESSD graphic (Option C). I would leave the decision to post it and replace the current graphic to you, depending on your sense of where this discussion ends up. If possible, a bar representing contrails might still be helpful. Dtetta (talk) 22:22, 7 December 2023 (UTC)
The quantities shown are very different than in the IPCC SPM graphic. Methane contribution is radically different, and Nitrogen oxide goes from a substantial negative to positive. The science has not changed in the last year around these measures, which means the charts are looking at different measures. We should understand what those differences are. For instance, they could be looking at cumulative impact to date, current impact this year, or net impact going into the future (so that CO2 ranks much higher than methane, which has a short life span). Do you understand why the measures are so different? Absent understanding, I trust an IPCC SPM graphic to be more accurate for what scientists would like to see conveyed to the public as the graphic is the high profile way scientists communicate with policy makers.
Graphically, the main drawback of the new graphic is the tiny fonts relative to image width. The majority of our viewers are on smartphone, and most of the remainder will only ever look at a thumbnail view. Wikipedia standards for thumbnail graphics is that they should not be more than upright=1.35 for accessibility reasons (or they can be full width but not in the lead). You need to show both graphics at upright=1.35, and at that width it will be clear that the new graphic is not legible to most users. The fonts in the existing image resemble those on a wikipedia page at that scale.
In terms of text, "Land Use" is likely inaccurate as it is shown as a dampening effect, so it cannot include deforestation. In the graphic I made Femke and I changed that to irrigation and albedo to be accurate. Also, "solar warming" is inaccurate, as all global warming is solar. I assume what it is trying to convey is differences in the intensity of sunlight, but I am surprised that the new graphic would say there is a net gain there. The IPCC said it's an insignificant factor. Efbrazil (talk) 00:33, 8 December 2023 (UTC)
Efbrazil-thanks for those comments. I will defer to Craig to resolve your graphic concerns and the solar labelling issue. Regarding your other comments:
On the emissions estimates, the authors very thoroughly document how their estimates are different from the most recent AR6 estimates, and why the current ones are an improvement. I think if you read the article you’ll find answers to the emission related questions that you are posing.
Regarding land use effects, in the article itself we have long described the net effect of land use change as a slight cooling, due to surface changes in albedo, which is consistent with the ESSD graphic (and the current graphic as well, in the “irrigation and albedo” row). The other components of land use change is its contribution to greenhouse gases, which obviously has a warming effect, as you point out, but it’s not broken out in either the current graphic or the ESSD graphic per se; those land use change emission increases are just part of the total GHG emission estimates, I believe. Perhaps that label in the new graphic should be clarified to say “Land use albedo”, or something similar.
And regarding the solar issue, IPCC AR6 WGI Chapter 3.3.1.1.2 describes solar as having a minor role, but not an insignificant one.Dtetta (talk) 01:56, 8 December 2023 (UTC)
Substantively, I won't jump into a disagreement as to which source is more reliable; I think they may be talking about apples and oranges to some extent. Graphically, I originally chose a 16x9 aspect ratio to reduce vertical height occupied in articles, and because longer bars better distinguish among the factors. I do appreciate what you, Efbrazil, say about font size for people who won't click-to-enlarge, and I can make Option B shaped more like a square and also add contrails data. —RCraig09 (talk) 17:28, 8 December 2023 (UTC)
The problem is that I don't see a point in continuing with the new graphic. I prefer the existing graphic as do uwappa and clayoquat. I don't see how change is warranted here, especially when there are so many glaring problems that need to be fixed. Like see the discussion at Attribution of recent climate change. If you want me to tweak the existing graphic in some way please let me know what it is, that could be more fruitful than pursuing a replacement. Efbrazil (talk) 17:50, 8 December 2023 (UTC)
I think I have made a good case for why the graphic Craig has created is preferable. I don’t see any posts that have pointed out flaws in the arguments I presented. I agree that there should be a strong level of support before the current graphic is replaced. And I don’t mean to discount all the good work Efbrazil and Femke did to create the original graphic. However, the science based, non-graphical criticisms that have been raised (ozone, land use, solar, differences in GHG depictions) seem to be based on reading neither the ESSD article nor the relevant parts of the IPCC reports that should inform this discussion. It’s disappointing to see these conversations occur in this kind of fact-limited context. In the future, I would ask that you more thoroughly research the available information on a specific issue before you opine on it. And again, thanks Craig for being willing to put all that effort into developing an improved graphic based on the best available current information. Apologies if I have caused you to waste your time and talent. I hope that some additional editors will eventually see the value in it. Dtetta (talk) 18:37, 8 December 2023 (UTC)
Option C: ESSD Figure 2a
For graphical comparison, I've created and uploaded Version 3 of Option B. I added aircraft contrails, and changed to "Solar variability" as that's probably what the source meant by "solar"; be specific with any correction you think is needed. I think that prior questions about interpreting ESSD abbreviations have been dealt with, and that User:Uwappa and User:Clayoquot's opinions were more nuanced and not definitively in favor of the IPCC graphic. Again, it may be a question of IPCC apples vs ESSD oranges. I favor the ESSD's summation of TotalHuman and comparison to SolarVariability, as being the most instructive for current public awareness. —RCraig09 (talk) 23:55, 8 December 2023 (UTC)
Yes, this is a step forward. Still, some suggestions:
In a graph about warming, use degrees Celcius. It will make it possible to compare the total against the 1.5 and 2.0 C aims of the Paris agreement. Be careful with the combination of negative numbers and cooling. What is -2 cooling, is that +2 heating? The words 'cooling' and 'warming' seem redundant, remove them.
right align the green names of gases. Keep names close to the bars, just like the black drivers. Use just one colour for text labels. The { suffices for the grouping.
The border around the graph between the white and light grey acts as a visual barrier between label and bar. Why not have one background colour as in option A to keep labels and bars visually connected. Worth a try: all light grey background, vertical white grid lines.
sort the gases by impact, large to small: carbon dioxide, ozone, methane, halogens, Nitrous oxide. The sorting will help: what are the major drivers? Which are minor?
Sort the other drivers too: black carbon, contrails, land use, aerosols.
Option A has thick (0.5) and thin (0.1) vertical grid lines that help to scale a bar.
reduce the height of the bars to a size equal to the lowercase character height.
remove the horizontal dotted lines as they visually compete for attention with the bars and ranges. The quite narrow graph does not need horizontal lines to guide the eye.
put the range indicator in the vertical center of a bar, as done in option A. The current grey is too subtle, hard to see. Use a darker shade of grey or dark red/blue. The black in option A is too dark.
Add some vertical space above the total to set it apart. Try to remove the bar for the total, just keep the range. It will visually distinguish it from the other bars.
Version 4 is uploaded. 1. Not done: unknown conversion from W/m2 to Celsius. 2. Not done: GHG names are left-aligned to allow for foreign-language translations to spill harmlessly to right rather than leftward atop the "{". 3. Blue and red tinted backgrounds are re-introduced (forgotten in Version 3). 4.5.6.7. Stylistic; not done. 8. Done. 9. Not done, since confidence intervals will distract and confuse non-techy lay readers. 10. Stylistic; not done. —RCraig09 (talk) 07:07, 9 December 2023 (UTC)
Earlier I said, "Overall I prefer Option A, then C" and this has been interpreted as "not definitively in favor" of Option A. So to be clear, I definitively favor Option A. The sourcing of Option A is top-notch: We all consider the latest IPCC reports to be a gold standard because the process that goes into them ensures they have wide acceptance in the scientific community. The sheer quantity of process involved creating IPCC reports always makes them a little bit behind the latest research and the Wikipedia community is OK with that. It takes a very strong argument to choose another source to replace the latest IPCC report, and I haven't seen a strong-enough argument yet.
I also like how Option A has more detail. I really dislike how the Option B at first glance suggests that "land use" is overall cooling and you have to read and understand a footnote to see that that might not be the case. The main raison d'etre of Option C seems to be that it compares the anthropogenic total to solar variability. I'm not sure how important it is to convey this in a graph, but if you feel it's important a cleaner solution would be to add a graph containing ONLY "total anthropogenic" and "solar variability". Clayoquot (talk | contribs) 22:11, 9 December 2023 (UTC)
I'm sorry for misinterpreting your earlier post, Clayoquot. Re sourcing: the two sources give viewers essentially the same impression re the relative makeup of causes of global warming, and are of comparable reliability, but critically: this graphic is about what causes global warming. Importantly, Option B shows the casual viewer that it's humans that cause current GW, not solar variability as some deniers think. Never lose sight of the fact that our target audience is the lay reader of a public encyclopedia, not a Ph.D. candidate review committee looking to critique microscopic discrepancies between scientific organizations. And Option A's "irrigation and albedo", and breakdown into seldom-discussed aerosols, aren't friendlier than Option B's useful, plain-language footnote. —RCraig09 (talk) 23:28, 9 December 2023 (UTC)
This preference for IPCC reports over this ESSD report, based on the IPCC reports being some sort of gold standard for climate change analysis, has now been claimed by a couple of different editors in this thread. IMO this is a distinction without a difference. As this post by one of the ESSD report authors states, virtually all of these indidviduals are involved in the recent IPCC report series. You can also verify this by searching individually by the author’s name and the word “IPCC”. The idea that a group of 50 IPCC level authors is producing less reliable work because they are doing it outside the IPCC reporting cycle is simply not credible, IMO. Femke attested to the high quality of this group’s work in her October 26 post. Moreover, these same IPCC authors point out in detail in the article precisely how and where their work differs from AR6, and the manner in which they have improved upon the latest AR6 WGI figures relevant to this discussion. If, in fact, the “Wikipedia community” is ok with with aspects of CC research that have been shown by these IPCC authors to be outdated in certain details (in the paper it’s clear that it’s only some aspects of AR6 WGI that these authors are updating), that’s a sad reflection on the community. But I am not presuming to speak for the WP community at large.
I can understand Clayoquot’s concern about how the ESSD graphic and Option C can give the impression that land use has an overall cooling effect, and in turn discount the role that AFOLU emissions play in global warming. However, that is also an issue with the current graphic and text. I would imagine that the text is what most people read, and it clearly talks about land use change having a cooling effect in terms of albedo changes (that was one of the first subsections I worked on back in 2019). At that time I had also created additional text that tried to clarify these distinctions, but that text was later removed and some of it moved to the earlier subsection on greenhouse gases, which has the effect of muddling this issue somewhat.
Going back to the graphics themselves, I have a hard time believing that any general reader would even understand what the combined term “irrigation and albedo” in the current graphic actually means (the actual label in SPM 2b is “Land use reflectance and irrigation”, and that combination term is certainly not clarified anywhere in the article’s text, so the current graphic is short of the mark on this issue as well, and therefore I don’t think it’s a valid reason for considering Option A as superior to Option C. If the label in Option C is changed to Land use-albedo (or land use reflectance, like in SMP 2b), IMO that would make the graphic/text relationship consistent, and should help make it clear that this row in the graphic is not contradicting the warming effect of AFOLU GHG emissions. Dtetta (talk) 07:02, 10 December 2023 (UTC)
I have been keeping an eye on this discussion for a while, but I was too preoccupied with working on the Greenland ice sheet article to participate earlier. Now, the discussion has become very dense, and I am not sure if I can contribute to it meaningfully.
However, what I would like to do is ask the participants in this discussion to take a look at the attribution graphics which are currently used in scientific consensus on climate change. There are several, two of which had already been present, and I have added another one, which is primarily used in articles which describe the effect of sulfate particulates, such as global dimming. However, that one is quite old, and I am a little concerned it may contradict the newer ones on certain details.
And if anyone here would like to comment on some other questions raised on that article's talk page, I would really welcome that too, regardless of which opinion you would express. InformationToKnowledge (talk) 18:43, 11 December 2023 (UTC)
So a specific concern with the existing graphic is using the word "albedo". Albedo is arguably jargon, and is not entirely accurate as I believe the measure is just looking at human caused changes, not feedbacks like the loss of snow and ice cover. In defense of albedo, it is mentioned in the article many times, including in the section where the graphic is.
"Land use reflectance" is word salad that you need to untangle to mean "relectance of the land surface to sunlight as a result of land use changes", and I'm not sure people will make that translation in their head. It is also arguably confusing, as "land use" is almost always tied up in the idea of emission changes as the result of deforestation.
How about if we change the item to this:
Irrigation and albedo*
And add a footnote at the bottom saying this:
* Humans caused changes to the reflectivity of Earth's surface Efbrazil (talk) 19:29, 11 December 2023 (UTC)
IPCC sources of Physical_Drivers_of_climate_change.svg are in Celcius. No conversion required, see:
Looking more thoroughly at the IPCC report, it appears that Option C (the unmodified ESSD figure) is an updated version of a figure that in fact already exists in IPCC AR6 WGI. It is Figure 7.6 in AR6 WGI Chapter 7.3.5.2. I think an argument could be made for modifying the solar ERF in Option B (0.06) and using the value from AR6 WGI Fig.7.6 instead (0.01), as the value that the ESSD authors use is from a single year (2022). Either way, depicting solar as having a minor (but not negligible) role is consistent with the IPCC AR6 language. It’s also clear from figure 7.6 how closely linked these authors are with the IPCC work.
Also worth noting is that in the “More frequent extreme weather with global warming” graphic RCraig09 created also used detailed data from body of the IPCC report, rather than just the SPM summary information, to create a graphic that was superior to the one in the SPM portion of the IPCC report, IMO. I say that because I think even Figure 7.6 as it currently exists is superior to the current graphic (Option A) in terms of supporting the text in the article, Option C (the unmodified ESSD figure) is superior to Figure 7.6 for the reasons cited in the ESSD paper, and Option B is yet a further improvement thanks to Craig’s great work. Dtetta (talk) 03:28, 13 December 2023 (UTC)
Alternative: temperature rise and drivers in same chart
Another thought, a graph that shows temperature rise in time and the contributing factors
a line graph similar to https://flo.uri.sh/visualisation/15958473/embed?auto=1 with years till current on x-axis, observed temperature change on y-axis
per year: stacked bars for contributing factors. One stack with cooling factors going down, one next to it, starting at the cooling low, with stacked heating factors.
Is there a reason why we use the wording "physical climate model" in several instances, instead of just "climate model"? Are we distinguishing it from a "chemical climate model" or a "mathematical climate model"? Note that in the article on climate model, the term "physical climate model" does not appear. EMsmile (talk) 09:24, 1 December 2023 (UTC)
The article makes the distinction in 2 sentences- "A climate model is a representation of the physical, chemical and biological processes that affect the climate system." and "A subset of climate models add societal factors to a simple physical climate model." Efbrazil (talk) 17:57, 1 December 2023 (UTC)
Still not clear to me. I suggest dropping the "physical" here for simplicity reasons "Physical climate models are unable to reproduce the rapid warming observed in recent decades when taking into account only variations in solar output and volcanic activity." Note that elsewhere in the article we usually just say "climate model", not "physical climate model". If we think that the term physical climate model was important for our layperson readers then why doesn't it appear even once in the article on climate model?
Also what do we mean exactly with "to a simple physical climate model"? In which sense is it "simple"? There is nothing simple about most climate models as far as I can see. EMsmile (talk) 11:18, 18 December 2023 (UTC)
Change “Attribution of recent temperature rise” to “Causes of global warming”
Is there a reason we can’t change the title of Section 3 to “Causes of global warming”? The current title seems overly technical and also euphemistic. Dtetta (talk) 23:44, 21 November 2023 (UTC)
I'll follow this discussion with interest as I've also wondered in the past what "attribution of" really means and if it's something that native English speakers understand more easily than non-native speakers like myself. Is it a "lay person friendly" term?
While looking at that section I came across this sub-section: "Solar and volcanic activity" and wonder why the two are lumped together. I think they should be split in two sub-sections because volcanic activity is clear, whereas solar activity is less clear (and not really a key attribution of recent temperature rise"; see also here: https://en.wikipedia.org/wiki/Attribution_of_recent_climate_change#Factors_that_are_not_key_attributions_of_recent_climate_change ) Isn't that solar activity thing something that the deniers like to throw into the ring but it's really a dead horse regarding the recent global warming? Then why put it at the same level and together with volcanic activity? EMsmile (talk) 08:49, 22 November 2023 (UTC)
Solar and volcanic activity and the two natural drivers of any note, and the 3 paragraphs of text discuss them together in that context. I don't see a real advantage in breaking them apart. Efbrazil (talk) 18:56, 22 November 2023 (UTC)
"Causes" isn't correct as the section includes feedbacks, which are climate sensitivity factors, not causes of warming. All the scientific papers use the word attribution and our sub article is called "Attribution of recent climate change". Attribution is a matter of breaking temperature increase down into constituent elements precisely, whereas causes can just be a list of triggers. I also like "recent temperature rise" instead of "global warming", as the section focuses on breaking down factors in the temperature change. I understand the desire for accessibility, but I think precision is better here. Efbrazil (talk) 18:54, 22 November 2023 (UTC)
(a) It's a little weird, but not "wrong", to group solar" and "volcanic together. I would distinguish them into separate subsections, but it's not a huge issue as they are secondary to GHG as a driver. (b) More importantly, the section title, "Attribution of recent temperature rise" is nicely descriptive, and is very broad—broader then Causes of global warming—and so it's not fatal or inaccurate to include feedbacks as a subsection. (c) I think a section name change to "Causes of recent temperature rise" is both friendlier-to-laymen, and accurate. —RCraig09 (talk) 21:32, 22 November 2023 (UTC)
I appreciate Efbrazil’s point that attribution is a precise way of describing the different factors being discussed here. But If “causes” was truly an incorrect term in this context, I don’t think it would be the term of choice for the NASA webpage titled: The Causes of Climate Change. And they are talking about the same kinds of “lines of evidence” reasoning that we discuss in this subsection. The IPCC uses “attribution”, and I’m sure there are a number of peer reviewed scientific papers on this topic that use that term as well. But for a website that is supposedly aiming for a high school level audience, it seems like a more common, but still accurate word, such as “causes” or “drivers”, is a better choice. We use “drivers” a number of times, so that would also seem to be a viable candidate. I prefer “causes”, as it seems like the more common way this issue is described. Dtetta (talk) 07:16, 23 November 2023 (UTC)
Re: the term “global warming”, vs “temperature rise” we now use those terms interchangeably, with “temperature rise” in the Section 2 title, “global warming” the Subsection 2.1 title, and “temperature rise” again in the Section 3 title. I wonder if “temperature rise” was originally selected because the earlier title of the entire article was “global warming”, and earlier editors did not want to repeat the title as part of a section? To me it’s clearly a euphemistic way of describing what’s going on, but I would be fine with RCraig09’s proposal. Dtetta (talk) 14:54, 23 November 2023 (UTC)
Where do we stand with this now? Do we have a consensus to change the section title to ""Causes of recent temperature rise""? EMsmile (talk) 09:22, 1 December 2023 (UTC)
It has been changed to "Causes of recent temperature rise" (suggested by me 21:32 22 Nov, agreed to by Dtetta 14:54 23 Nov). —RCraig09 (talk) 21:52, 1 December 2023 (UTC)
That's good. It says now in that section: "Main article: Attribution of recent climate change". Wouldn't this also make the case for changing that sub-article also to "Causes of recent temperature rise"? There's been a bit of a discussion on that article's title and focus on its talk page but we seem to be a little "stuck" there. EMsmile (talk) 11:23, 18 December 2023 (UTC)
Primary image updated to include 2023 data released today
I switched from using a 10 year average comparison to NASA's "trend" comparison, going from 1973 to 2023 using annual temperatures. Results are similar but hopefully a bit more accurate and easier to understand. Updates involved stomping on internationalization unfortunately. For more info, see the image description, and let me know if you see any issues. Efbrazil (talk) 19:57, 12 January 2024 (UTC)
Brill, thanks! Wdym with stumping on internationalisation? Looks more smooth this new graph :). I'm not sure what the 'annual' is doing in the figure. An annual trend would be something like 0.02C/year of GW, right? —Femke 🐦 (talk) 20:07, 12 January 2024 (UTC)
Thanks! I just removed "annual" from the graphic, you're right that it was confusing. I was trying to say that the trend was based on annualized data, but it read like it was a measure of annual temperature changes instead. Also a few other minor tweaks in there, like saying "over the past" instead of "in the last".
The wikimedia file had been updated a few times for internationalization purposes. I had to regenerate the files from source, so those edits were lost.
The caption to the image I struggled with a bit too, feel free to critique. It's kind of redundant with the image title as it exists, but I didn't want to go too verbose either. Efbrazil (talk) 21:23, 12 January 2024 (UTC)
Reducing energy use?
I am challenging this statement in the lead that it is necessary to reduce enrgy use, because it is wrong or at least not the only way to reduce emissions. A "or" instead an "and" would fix that.
See the section on "Reducing and recapturing emissions", which captures the issue.All major pathways to staying under 2.0 C require both a switch to low carbon energy sources and also energy conservation. While it is certainly possible to meet targets only through conservation or only through a switch to low carbon energy sources, taking those approaches will be far more painful socially and economically. Efbrazil (talk) 22:05, 3 December 2023 (UTC)
Efbrazil, sources in the lead use the term "energy efficient". Can you quote which source is saying reduced energy use with page numbers and quotes? Bogazicili (talk) 22:36, 14 December 2023 (UTC)
See further down. I agree that reduced is a problem, that's not the issue, it's just figuring out the correct text to use instead. Efbrazil (talk) 01:02, 17 December 2023 (UTC)
The sentence "Reducing emissions requires reducing energy use..." might suggest that global energy demand needs to go down, whereas as far as I know the sources discuss demand reduction in specific contexts where there are ways to reduce demand relatively painlessly. "Reducing emissions requires measures to conserve energy..." would be more accurate. Clayoquot (talk | contribs) 06:37, 15 December 2023 (UTC)
I agree that "reducing" is problematic as it is not accurate for developing economies.
I don't want "or" to replace "and", since no pathways frame the issue as a choice between the alternatives- this is a "both" situation.
I think "measures to conserve" is a problematic because people's eyes will glaze over when reading that and it is also not inclusive enough. Energy conservation does not capture lifestyle changes like living in cities, eating less meat, consuming less, right to repair movements, and so forth. In other words, energy conservation is just one way to limit energy use.
How about we replace "reducing energy use" with "limiting energy use"? The overall sentence would then be "Reducing emissions requires both limiting energy use and generating electricity from low-carbon sources rather than burning fossil fuels." I added "both" to make it clear the "and" is intentional and to force both ideas into people's minds. Objections to that as a solution? Efbrazil (talk) 19:53, 15 December 2023 (UTC)
Actually, to take my proposal a bit further, I think the current sentence is a bit awkward in ending with " rather than burning fossil fuels". The idea should be attached to "Reducing emissions", not to the last past of the sentence that talks about electrification. So let me amend my proposal to this:
Reducing emissions requires phasing out fossil fuel use by both limiting the use of energy and generating electricity from low-carbon sources. Efbrazil (talk) 00:43, 17 December 2023 (UTC)
I think that this is a lot better than the previous proposal, as the word "limiting" can very easily be interpreted as more restrictive than "reducing", and bring to mind things like energy quotas that are not part of any mainstream proposal I'm aware of. At the same time, I believe it can be made better still. Here is my proposal:
Reducing emissions to stabilize the global temperatures requires replacing fossil fuel use with energy from low-carbon sources. Building low-carbon sources takes time, and a phaseout of fossil fuels fast enough to avoid severe effects of climate change would also close the gap through reductions in global energy demand.
I think this version should finally be unambiguous about both the aims, the methods and the reasoning behind them. InformationToKnowledge (talk) 12:44, 17 December 2023 (UTC)
Fair point about the word limiting, although the suggested wording says reducing global demand is a goal, which it isn't. The issue is reducing demand in first world countries so that fossil fuel sources can actually be phased out, instead of having renewable energy be additive. We also need to be mindful of overall length, as the lead is already near the limit of what is acceptable. I'm also not a fan of framing demand reduction as a purely transitional issue, since demand reduction can be a long term solution in the developed world in particular. How about this:
Reducing emissions requires phasing out fossil fuel use. This can happen by reducing demand in developed countries, conserving energy, and generating electricity from low-carbon sources.Efbrazil (talk) 19:16, 17 December 2023 (UTC)
Contribution of various mitigation measures to decarbonization in the IEA Net Zero Emissions Scenario "Reducing demand" is better than "limiting" for the reasons mentioned above. Re Energy conservation does not capture lifestyle changes - actually it does, as described in the Energy conservation article that we already link to. Energy conservation can be broadly thought of as technical efficiency plus behavioural change. I understand the concern about people's eyes glazing over so I'll propose a solution for this.
Demand reduction is not just for developed countries which host 17% of the world's population; there is lots of opportunity in developing countries as described in sources like this one.
To solve the eyes-glazing-over problem, well we probably can't 100% solve it but it will help a lot if we give behavioural change wp:due weight. Mainstream high-quality sources give demand reduction a relatively minor role in decarbonizing the energy system: In the IEA's pathway it's 24% and in IRENA's pathway it's 25%. Behavioural change is a fraction of these fractions. The IEA Net Zero Emissions Scenario says "8% of emissions reductions stem from behavioural changes and materials efficiency gains that reduce energy demand, e.g. flying less for business purposes."
We should not be saying in Wikipedia's voice that reducing emissions requires phasing out fossil fuel use, as this is controversial. In general, the word "requires" for mitigation options implies higher certainty than exists in the higher-quality literature. We should also avoid suggesting that the proposed magnitude of increase for nuclear power is on par with the magnitude of wind and solar build-out.
Strategies to reduce fossil usage involve generating electricity cleanly, using electricity to power transportation, heat buildings, and operate industrial facilities, and conserving energy. The electricity supply can be made cleaner and more plentiful by vastly increasing deployment of wind, and solar power, alongside other forms of renewable energy and nuclear power.
Reads good - that change looks like an improvement to me Chidgk1 (talk) 16:45, 18 December 2023 (UTC)
That's generally an improvement, but I still have concerns.
"Reduce fossil fuel use" is too weak, as it could just mean a 5% reduction. There are no pathways that don't involve the substantial phase out of fossil fuel use. I think it is OK to leave the words "phase out" as we are not being prescriptive and saying it must be done in all cases, but rather the sentence is saying what actions that direction requires.
I think we need to give a bit more prominence to energy conservation. Two words at the end of a list is not 25% of the attention, and I think it's arguable that the issue deserves more than 25% of the attention. The wealthiest 10% are responsible for 50% of global emissions, while the bottom 50% are responsible for 8%. If global consumption keeps rising then renewable energy will just supplement fossil fuels rather than supplanting them. There is both a pathways issue here and also a social justice issue here.
To fix things I propose going back to "phase out" and then beginning the list with "conserving energy" rather than ending with that. So here's the proposal:
Your first point makes sense. It sounds like the only issue for which we aren't on the same page yet is where to put "conserving energy" to give it due weight. I'll think about this one some more. Clayoquot (talk | contribs) 00:51, 19 December 2023 (UTC)
I've put in what you suggested for now. Cheers, Clayoquot (talk | contribs) 21:48, 20 December 2023 (UTC)
Just chiming in to say I like the new wording, in case anyone tries to change this part in the future. Bogazicili (talk) 06:55, 20 January 2024 (UTC)
Current level of warming in lead, suggested changes
Text now in lead:
Many climate change impacts are already felt at the current 1.2 °C (2.2 °F) level of warming.
The lead does not define the word current , neither does the chapter Terminology.
Current could mean:
now, today, this month, this year, 2024, which seems to match "are already felt" and this quote from this BBC article "2023 confirmed as world's hottest year on record": "It raises the possibility that 2024 may even surpass the key 1.5C warming threshold across the entire calendar year for the first time, according to the UK Met Office."
somewhere in a 20 years period, as in this quote from Copernicus: For the rest of 2023, global daily temperature anomalies above 1.5°C became a regular occurrence, to the point where close to 50% of days in 2023 were in excess of 1.5°C above the 1850-1900 level. This does not mean that we have surpassed the limits set by the Paris Agreement (as they refer to periods of at least 20 years where this average temperature anomaly is exceeded) but sets a dire precedent. This 20 years average matches the definition given in Modelling.
Suggestions:
Make text in the lead unambiguous: In 2023, at 1.48 °C (2.66 °F) level of warming, many climate change impacts were felt already.[1]
Move the '20 years' definition from Modelling to either Terminology or Impact.
Detail current and future impacts in the chapter 'Impacts'. Split it into 3 subchapters which include text currently in "Tipping points and long-term impacts"
For #1 that's good sourcing and I like the idea, but I think the sentence can be better structured so that we're not containing impacts to 2023, but rather just specifying the temperature in that year. How about this:
Many climate change impacts are being felt at the current level of warming, which is at 1.48 °C (2.66 °F) as of 2023. Efbrazil (talk) 22:26, 15 January 2024 (UTC)
Agree, impacts should not be contained to 2023. Be cautious with "current level of warming". That could be interpreted as the 20 year average of 2004-2023 where the +1.48 °C was in 2023, the warmest year on record.
Alternative:
Many climate change impacts have been felt in recent decades, with 2023 as the warmest year on record at +1.48 °C (2.66 °F). Uwappa (talk) 23:47, 15 January 2024 (UTC)
I think there's a substantial misunderstanding here. As indeed said in the Copernicus link, "current" refers to the 20-year average: not "somewhere" within 20 years, but an average of all those years. The reason why an average is important, is because the temperature of any given year can vary by up to 0.2 °C (0.36 °F) in either direction. You can see this on practically any global temperature graph. You can see this in the AR6:
It is likely that well-mixed GHGs contributed a warming of 1.0°C to 2.0°C, other human drivers (principally aerosols) contributed a cooling of 0.0°C to 0.8°C, natural drivers changed global surface temperature by –0.1°C to +0.1°C, and internal variability changed it by –0.2°C to +0.2°C.[2]: 5
Other papers confirm that the 0.2 °C (0.36 °F) difference can indeed occur from one year to another:
At the time of writing, that translated into 2035–2045, where the delay was mostly due to the impacts of the around 0.2 °C of natural, interannual variability of global mean surface air temperature[3]
What this means is that a year at 1.48 °C (2.66 °F) is just about what we would expect from the temperature average of about 1.28 °C (2.30 °F). We would not really be able to start talking about an 1.5 °C (2.7 °F) average until there are years at 1.7 °C (3.1 °F).
I suppose that if this point can confuse even veteran editors of the WikiProject, it should probably be somewhere in this article. I'll let the editors who have spent more time on this article than me decide where it should go. InformationToKnowledge (talk) 07:34, 16 January 2024 (UTC)
Replying to Uwappa text, getting closer, although I don't think it is necessary to say "decades". Maybe just this:
Many climate change impacts have been felt in recent years, with 2023 as the warmest year on record at +1.48 °C (2.66 °F).
Replying to the point InformationToKnowledge makes about how much smoothing should be applied to define "current" temperature, I think we can put that aside as an issue for the lead, especially since Uwappa's text no longer says "current". The issue gets complicated as the "current" temperature most correctly applies to the trend line and not simply averaged years, and that can easily be higher than the temperature of any particular year as temperatures are rising (as was the case in 2022 for instance). We could add a digression on that issue somewhere later on in the article, but I don't think it belongs in the lead. Efbrazil (talk) 17:01, 16 January 2024 (UTC)
Efbrazil, a second thought: 'Recent' would require a definition too. So it is not any better than 'current'. 'Recent years' could falsely imply that no impacts were felt, 10, 20 years ago. An alternative, make the 20 years explicit:
In the past 20 years, averaging at +1.2 °C (2.2 °F), many climate change impacts have been felt, with 2023 as the warmest year on record at +1.48 °C (2.66 °F). Uwappa (talk) 12:41, 17 January 2024 (UTC)
I generally like this, but a possible issue with this phrasing is that to some, it may imply that the impacts weren't felt until the past 20 years. This might be even better:
In the past 20 years, temperatures averaged at +1.2 °C (2.2 °F) and 2023 was the warmest year on record at +1.48 °C (2.66 °F). Climate change impacts have become apparent as many historical [weather] records were broken.
I placed square brackets around "weather" because that word is serviceable, but I would ideally prefer a term which would also convey that the other preindustrial records we don't normally think of as weather - i.e. ice sheet loss - have also been broken. I would appreciate it if others could come up with one. InformationToKnowledge (talk) 13:18, 17 January 2024 (UTC)
I believe the proposed text reflects a basic misreading of the source. The source for 20 years is simply talking about using a 20 year smoothing average for temperature trends, not saying that we average the last 20 years and call that "current", or that there must be 20 years of data before we can say we've exceeded 1.5 C. Further, change didn't start to magically happen 20 years ago- there is no magic cutoff date. Put another way, impacts in the last few years are much greater than the impacts were 20 (or 21) years ago.
I think the best wording is what I proposed up above. Scoping to "recent years" makes it clear that we are not talking about a few days or a few decades, but rather a few years closing in on today. That sets the scope correctly without being pedantic about the issue. Efbrazil (talk) 17:22, 17 January 2024 (UTC)
Efbrazil, I would love to agree with you. I am so sorry to bring bad news: Yes, the Copernicus source does say we need 20 years of data before we can say we have exceeded 1.5C. See "Current could mean", point 2 above with the quote from Copernicus and a link to the source.
"Even though the temperature will need to stay at or above 1.5 °C for 20 years to pass the threshold defined by the Paris agreement..."
So, Have one "cool" hour at just +1.49 °C and we start a fresh count for 20 years? This seems totally ridiculous. As there is no source given for the 20 years, I've searched the primary source, the text of the Paris agreement and found the 1.5 C limit on page 22, article 2.1.a. I did not find anything about a 20 year period. I did not find anything either on how the "the increase in the global average temperature" is measured.
I think we should ignore the "20 years" for the moment, remove it from the chapter Modelling. I support your proposed text for the lead, please include a ref to the BBC article. Uwappa (talk) 22:59, 17 January 2024 (UTC)
Thanks for the research. The Copernicus source that we're all talking about is just a single parenthetical, so I'm glad we're going back to source documents. The AR6 TS has this text:
Timing of crossing 1.5°C global warming: Slightly different approaches are used in SR1.5 and in this Report. SR1.5 assessed a likely range of 2030 to 2052 for reaching a global warming level of 1.5°C (for a 30-year period), assuming a continued, constant rate of warming. In AR6, combining the larger estimate of global warming to date and the assessed climate response to all considered scenarios, the central estimate of crossing 1.5°C of global warming (for a 20-year period) occurs in the early 2030s, in the early part of the likely range assessed in SR1.5, assuming no major volcanic eruption. (Section TS.1.3, Cross-Section Box TS.1)
Further: The time when a given simulation reaches a GWL, for example, +2°C, relative to 1850–1900 is taken as the time when the central year of a 20-year running mean first reaches that level of warming.
So I think my interpretation is correct with regards to the IPCC, and Copernicus was just sloppy in their wording. I'll make the updates tomorrow if there's no objections. Efbrazil (talk) 23:41, 17 January 2024 (UTC)
No objections. Go for it!
Did some more research and found this quote at https://www.climate.gov/news-features/features/whats-number-meaning-15-c-climate-threshold
"It's also important to note that the Paris Agreement does not specify how many years should make up this long-term trend, which dataset should be used, and which time period makes up the pre-industrial period. That means different scientists, governments and groups might come to different conclusions about when Earth passes this critical threshold.".
It's ... astonishing. I expected an unambiguous definition for the +1.5C limit. It just does not exist. Uwappa (talk) 00:08, 18 January 2024 (UTC)
Seen your improvements in Modelling. Thanks. As different groups might come to different conclusions: Make it clear which organisation comes up with a forecast, expectation, etc. Updated Modelling, made it clear that it is IPCC's expectations. Uwappa (talk) 00:35, 18 January 2024 (UTC)
Sure, that works, although we do use IPCC as the gold standard in this article. Anything not explicitly scoped to one source or the other is usually from the IPCC as it represents the latest consensus science.
Back to the 1.5 C Paris thing, there are some remarkable gaps in these reports. This is a digression, but one issue that bothers me is that older IPCC reports would talk about how much emissions would cause how much warming, and then would have high uncertainty in their models because of carbon cycle unknowns. Newer reports base all their modeling on RCP values, which are CO2 equivalent concentrations in the atmosphere, which is a sleight of hand that allows them to ignore the issue of the carbon cycle. It might seem a little wonky of a complaint, but it cut the uncertainty in half when they did that. To my way of thinking, they should still be talking more directly about what people are doing vs how the planet is reacting. Efbrazil (talk) 00:41, 18 January 2024 (UTC)
Tweaking reports, definitions, a soothing 20 year average, won't change the reality that people experience.
In 2023 reality kicked in at +1.48C. People have experienced heatwaves, droughts, floods,cyclones, failed crops, etc. 2024 already started way warmer than 2023. So it would not surprise me if 2024 is the first of many years above +1.5, even if CO2 emissions would be zero tomorrow, which they won't. Looking at 2024 could even have many days above +2.0C. Serious climate change is not something of a distant future, it is current.
What this climate change article can do:
List the impacts of +1.5C and +2.0C, as mentioned in my point 3 above.
Find sources to keep graphs such as , , up to date, so people see the current reality. How close are we are to the limits?
Again, I think that the point which I have been trying to make earlier has been missed.
That is, that when published scientific literature describes "impacts of +1.5C", it does not mean impacts in any single year where the average temperature is just over 1.5C. Instead, it refers to impacts which would be certain to occur in a climate where the annual temperature is in the +1.3-1.7C range (and the majority of years are obviously around +1.5C) - because the annual temperature is always in this kind of range in any climate. Likewise, "impacts at +2.0C" really means "impacts at +1.8-2.2C", at +2.7C means at +2.5-2.9C", etc. This is also where the average, however, defined, comes in.
This is also the point which apparently really needs to be clarified in either modelling or terminology. InformationToKnowledge (talk) 15:30, 18 January 2024 (UTC)
That's well said. Since you are focused on the connection to impacts, perhaps that's the section where it best belongs. Perhaps you could add a sentence to the last paragraph of impacts / environmental effects, where 1.5 C impacts are discussed? Efbrazil (talk) 20:00, 18 January 2024 (UTC)
I did some reorganization and there is now a section titled "future global temperatures" that leads with this issue. I hope that scratches the itch. Efbrazil (talk) 20:11, 20 January 2024 (UTC)
Great! Suggestion: move the time related chapters together:
2. Global temperature rise
2.1 Prior to global warming
2.2 Current temperature rise
2.3 Future global temperatures
3. Causes of global temperature rise
4. Modelling Uwappa (talk) 08:55, 21 January 2024 (UTC)
Yeah, I get the argument for that, and was mulling the same thing yesterday. Thanks for the nudge. I made the change to put future temperatures in that section, but kept "prior" as the last item, as I think it is arguably there to offer context for the two prior sections, not as something that is meant to stand on its own. I get the appeal of being sequential, but in this case I think it's better to lead with the topic of the article. Take a look and see if it works for you... Efbrazil (talk) 18:38, 21 January 2024 (UTC)
It is an improvement to have temperature together in one chapter. Thank you.
For me the current setup is confusing, a roller-coaster in time, swinging backwards, forwards, forward again, and ends with going backwards and forwards:
2 Global temperature rise starts with a link to a main article going 2000 years back in time.
Chapter 2 itself describes the present and recent history. It also describes some impacts on glaciers, arctic and Gulf stream which should be in chapter Impact.
The text about the present lacks a 'current' subchapter heading.
2.1 forwards to the near future, 2023-2027, early 2030s, where 2023 isn't future anymore.
2.2 backwards millions of years, then forwards to pre-industrial times.
I strongly prefer to keep changes in sequence as change is a process in time. Mix up time and change is mixed up.
What I would like to see:
Provide overview of past and present with the graph at the top of chapter '2. Global temperature rise'. It will show 2000 years of history and the current rapid rise. That graph is like a summary of the whole chapter. That graph is currently misplaced in "Temperature records prior to global warming".
sequential subchapters for past, present and future. Tell the same story as the graph: climate change used to be a slow process. The speedy temperature rise of current climate change is exceptional.
Move impacts to the chapter 'Impacts'. A tough one: The chapter 'Impacts' could follow the same sequential structure. What were impacts of previous climate changes? What are current impacts? Which impacts will happen at +1.5C? Which at +2.0C?
A probably too radical alternative: Create main chapters 2. past, 3. present and 4. future, each having their own subchapters temperature and impacts.
The subchapter of past > temperature will describe slow climate changes in the past. Past > Impacts will describe impact of ice ages.
The subchapter of present > Impacts will describe current impacts of the rapid temperature rise.
The chapters on Modelling and tipping points can be subchapters of 4 Future. The subchapter future > Impacts will describe impacts at +1.5C, +2.0C and beyond.
I added a section header for "Differences by region", as that's the last 2 paragraphs of the first section. Hopefully that's a clear incremental improvement for now.
I can see the argument for moving graphics around as well. The trouble is moving back the 2000 year temperature trace to the first section (where it used to be) probably requires cutting a graphic by RCraig09, either ocean heat content or warm / cold records. I'm hesitant to trample his work, maybe he could chime in here?
If we are to resequence the entire section like you say then I think it will take more time and thought. A rewrite is probably required to some extent so that the section tells a story and hopefully uses less words in the process. I'm certainly open to that, but want to be careful. Maybe I'll tackle it tomorrow unless somebody else does first. Efbrazil (talk) 21:44, 21 January 2024 (UTC)
(I'm frankly not following details of the previous discussion but...) Generally, since so many readers "only look at the pictures", I'm disinclined to eliminate charts. Specifically, re Global temperature rise, I think it's important to emphasize both the degree and the depth of warming that are the very basis of climate change. Re the degree, a "...Record temperatures" chart seems very convincing; and re depth, the ocean heat content graphic is enlightening. Detail: Re "...Record temperatures", one of the newer charts at Commons User:RCraig09/Charts of record temperatures might be more appropriate than the "September records" chart. —RCraig09 (talk) 22:37, 21 January 2024 (UTC)
No need or desire to cut graphics. Graphics help to tell the story from past via present to future:
Do we have to feature what is effectively an RCP8.5 graphic (the "projected changes" one) so prominently? I would say that at the minimum, modifying the caption to clarify that point would be necessary, but since this graphic was apparently created by @Efbrazil, surely an SSP4.5 one can also be made? (Or a three-image one, with SSP4.5 in between the two presently existing images?) InformationToKnowledge (talk) 09:35, 22 January 2024 (UTC)
Unfortunately an SSP4.5 image was not produced by the IPCC. They only published the extremes. I actually wrote them to complain about the issue and got back a mealy mouthed excuse. I figured neither of the two RCP limits are reasonable at this point, so showing both of them is OK as people can imagine the point in the middle. Efbrazil (talk) 17:59, 22 January 2024 (UTC)
Alright, if that's the case, then I have expanded a caption with a version of the explainer I have used in other captions whenever 8.5-only graphics are available. InformationToKnowledge (talk) 18:16, 22 January 2024 (UTC)
Click at right to show/hide refs
References
^Poyntin, Mark; Rivault, Erwan (10 January 2024). "2023 confirmed as world's hottest year on record". BBC. Retrieved 13 January 2024.
^IPCC, 2021: Summary for Policymakers. In: Climate Change 2021: The Physical Science Basis. Contribution of Working Group I to the Sixth Assessment Report of the Intergovernmental Panel on Climate Change [Masson-Delmotte, V., P. Zhai, A. Pirani, S.L. Connors, C. Péan, S. Berger, N. Caud, Y. Chen, L. Goldfarb, M. I. Gomis, M. Huang, K. Leitzell, E. Lonnoy, J. B. R. Matthews, T. K. Maycock, T. Waterfield, O. Yelekçi, R. Yu, and B. Zhou (eds.)]. Cambridge University Press, Cambridge, United Kingdom and New York, New York, US, pp. 3−32, doi:10.1017/9781009157896.001.
^Samset, B. H.; Fuglestvedt, J. S.; Lund, M. T. (7 July 2020). "Delayed emergence of a global temperature response after emission mitigation". Nature Communications. 11. doi:10.1038/s41467-020-17001-1.
Ocean heat content graphics
I must say that to me, a lot of the chart discussions on this page are somewhere between bemusing and dispiriting, because as important as graphics are for getting the point across, too many discussions seem about choosing between very good and slightly better - all while so many related, highly relevant pages have been languishing without graphics or with insuffficient graphics for a very long time. This even involves pages with similar (or greater) views to this one, like the recently merged ENSO.
At the risk of perpetuating this, I would like to ask editors' opinion on the graphics from this two-week old paper (Communications, so the license is BY). All of them seem very good at a glance, but I would like to ascertain if you think any of them should replace the current heat content graph, or perhaps go somewhere else in this article (or simply illustrate ocean heat content.) InformationToKnowledge (talk) 20:01, 29 January 2024 (UTC)
My impression of the Nature Communications graphics is that they are overly complex and techy for use in a high-level article in a layman's encyclopedia. After years interacting on these pages, I've come to value clean and crisp graphics that portray one major concept per image. To simplify for the layman, I generally prefer avoiding jargon, and excluding or minimizing the distraction of uncertainty ranges. —RCraig09 (talk) 20:55, 29 January 2024 (UTC)
Global temperature and forces graphics updated
The fahrenheit and non-fahrenheit versions have been updated. Changes:
Observed data extended from 2020 to 2023
Added a 20-year smoothing line to match IPCC basis for estimating GGE impact on global temperatures
Removed confusing human+natural drivers trace (which is also now going out of date)
The 20-year smoothing was the most work. I did a 20-year moving average, then matched the lowess line smoothing value to that. Advantage of lowess is it extends to the limits of the data set (instead of cutting off 10 years before the end of the data set). Efbrazil (talk) 21:16, 29 January 2024 (UTC)
Definitely, an improvement. Minor suggestions for the future: I suggest changing the annual values to dots, and making the smoothed curve more dominant since the trend is more important than yearly variations . . . lightening the uncertainty range of the natural forces (which is less important than the natural forces themselves, and distracting or confusing to the lay reader) would make the uncertainty range less dominant. On reflection, it's somewhat inconsistent to show an uncertainty range for natural drivers, when there is also an uncertainty range for each observation, however small. —RCraig09 (talk) 21:28, 29 January 2024 (UTC)
Thanks! Good question about changing the annual line to points. I agree it would make sense if there weren't the "Natural drivers only" line, but with that line there I don't think the change is a good idea. They should either both be points or neither, and I don't think natural drivers should be changed to points and a trend line because the value is in showing how the annual fluctuations mirror the natural driver fluctuations (and that's how the IPCC presented the data).
As for uncertainty, I don't have data on the uncertainty for observed data, so I can't show that information. In more recent years I expect that uncertainty is close to zero. Natural drivers uncertainty is presented because that's how the IPCC presents the data and it helps to make clear that observations are really no longer explainable by natural drivers as of the 1980s or so. Efbrazil (talk) 00:15, 30 January 2024 (UTC)
@Efbrazil: I think it's OK to use dots for annual temperatures (since they're measurements) but despite inconsistency a line for natural drivers (since they're theoretically derived). I was only suggesting to make the green uncertainty interval much less dominant (lighter green or less opaque) so that the chart is friendlier for >90% of our readers but still satisfies scientific purists. —RCraig09 (talk)
I agree. Use red dots for annual values. Those dots will 'surround' the red line nicely and the 20-year line will be more the focus of attention. Also, it will make the chart less busy and make it easier to compare the red and green line.
I am not sure about smoothing. It is ingenious, but does not match the IPPC definition of a 20 year average.
Also, the light green area is not explained as being an uncertainty range. Is is relevant enough? The green line looks 'certain' but it can't be. Omit either the uncertainty or the green line? Uwappa (talk) 21:46, 29 January 2024 (UTC)
See above in my reply to Craig for the issue with going to annual data points instead of a line. The light green area is explained in the details for the image if you click in, but I agree it's a little odd that it's not explained in the caption or key. I'll give that some thought. Overall, I'm presenting the data the same way the IPCC did. Efbrazil (talk) 00:17, 30 January 2024 (UTC)
The black line is now overshouting the red line.
Alternative: change the black line to a thin, light red line or maybe light grey, with a bit of red, e.g. #E7C1C1. The 'red' and 'light red' colours will work together, as a team. Uwappa (talk) 00:34, 30 January 2024 (UTC)
True, but I don't know that the black line being most visible is bad, as that's the only real data here. It used to be all we showed in this graphic. The trend line and natural drivers lines are additions meant to provide context and aren't real data. The IPCC just switched from a 30 year to a 20 year trend line for instance (from AR5 to AR6), so those lines are kind of fungible off shoots of the real data, which is the black line. The red trend line is topmost in z-order, for what that's worth, but you are right that the black line is higher contrast and so more visible. Efbrazil (talk) 00:54, 30 January 2024 (UTC)
True, the black line is the only real data. That is why the black line could be changed to red dots, but the green line can not.
Real data is the wrong question. The question should be: what is more important, what deserves more attention, individual years or the long term general trend? See for another example of real data and trends.
Yes I know, it feels awkward to de-emphasize real data. That is like letting go of a solid true core of data, a Wikipedian unworthy. It was weird to do for but it worked amazingly well. See older versions of that chart for how a line was far worse than dots. Please try offline and upload a new version only if you like the result. Uwappa (talk) 01:23, 30 January 2024 (UTC)
Some additional thoughts:
The graph in the IPCC report is frozen in time. Such a report ships and the design iterations for graphics stop, no further improvements possible. At Wikipedia there is no deadline, no freeze. So you have the opportunity to design graphics that are improved versions of the ones in the golden standard of IPCC reports.
Do stick to source data, source definitions. It feels wrong, possibly even original research, to present a line that is not the 20 year average as used by the IPCC. The current chart may lead to the false conclusion that the current 20 year average is at +1.2C. It is not, it will be unknown for another decade. The line should stop 10 years before now. Alternative: show a thinner line for the last 10 years, indicating an estimate. But that does not feel right either, is too much like predicting the future, WP:CRYSTAL.
As and start to look similar, would it be an idea to add the +1.5 and +2.0C limits to ? Uwappa (talk) 10:03, 31 January 2024 (UTC)
I will add to the key an item talking about uncertainty in natural variability
I tried it out and do not want to remove the trace line for actual temperature readings, for several reasons:
That is how the IPCC presented the data in their report and how NASA reports annualized temperature data as well and how we have previously presented this data
Having a line above the natural variability line makes it clear how natural variation has influenced the variability in global temperatures (they fluctuate the same ways as a rule)
This is the actual data- we could cut all the other lines, but this needs to stay
Regarding the 20 year smoothing line being LOWESS instead of 20 year moving average:
The line does not say it is using the IPCC definition, and the IPCC never presents a graph with the 20 year average, it just talks about the number.
The NASA numbers we are plotting include a 5-year LOWESS average to show smoothing, all I am doing is setting that to 20 years to match the IPCC.
LOWESS traces the 20 year mean line with minimal error; if I wasn't telling you it was LOWESS based you couldn't tell by looking at it
LOWESS is what is often used so you can say when a trend line passes a threshold- years later when all data is in you can issue correctives
I think what's there now is helpful and accurate, and I would rather delete the line than show a moving average line that stubs out 10 years before current times.
I forgot to respond to the issue of emphasizing the 1.5 and 2.0 C limits. I will make the celcius horizontal grid lines darker. The numbers are already there so I don't know that it helps to make them red and blinking or whatever (there's already a lot going on in the graph). Efbrazil (talk) 20:27, 1 February 2024 (UTC)
As 2024 started way warmer than 2023, with SST already at record level in January, the question will come back again an again: Are we there yet? Have we crossed the +1.5C limit already? I think the graph should give an answer that is compatible with the IPCC definition of a 20 year average.
Alternative, inspired by InformationToKnowledge and Femke in talk Best chart candidates: show an extrapolation extending the 20 year average, the IPCC compatible answer: We don't know yet. Our current expectation is 203x. Wait a decade and you will have our answer for 2023.
See latest version of for how this could look:
till 2023: yearly average, dots with thin line, dancing around the average
till 2013: the 20 year average, thick line
2014-203x: expectation, lighter shade thick line, when will 20 year average cross 1.5C?
Yes, it will be different from the graph at https://www.ipcc.ch/report/ar6/wg1/static/77a100efc31fb024aee934abb2917576/8bb0e/IPCC_AR6_WGI_SPM_Figure_1.png So be it. But more important... it will be compatible with the IPCC definiton of the +1.5C limit. And it will look satisfying, visually, the line does not stop short.
Idea for emphasizing +1.5 and 2.0C, inspired by RCraig09: add 'limit' to their Y axis labels. Uwappa (talk) 20:33, 1 February 2024 (UTC)
Should year averages for 2024, 2025 cross the +1.5 limit, the chart will still give the scientific correct answer:
Please ensure the article doesn't become too large
Long paragraphs full of numbers are not easy to read (meeting 1a of the featured article criteria). The article is moving away from it <9000 words word length + decent readiability scores we so carefully managed. Quite a few of the new sentences added had length problems (>25/30 words, making them tough to read).
Even though it's nice to point our readers to all the articles we have, adding too much makes the article difficult to digest and cluttered. For instance, a "further reading" should contain too many links, at most 2, preferably 1.
I'm not objecting to everything in the recent edits, but please add it slowly, so that it's easy to start BRD cycles only for smaller bits. And keep in mind that most of our readers do not have academic reading capabilities. —Femke 🐦 (talk) 20:41, 31 January 2024 (UTC)
I agree generally with Femke on this issue. Example: the Copernicus graphic focuses on 2023, blurring all previous years, and is an inappropriate space hog for this high-level article. Separately, the "Causes of recent global temperature rise" (with subsections) is 4-5 desktop screenfuls long, and could be shortened, with full details moved to a new "Causes of climate change article proposed in the presently named Attribution of recent climate change article (please contribute to that [Renaming discussion)]. —RCraig09 (talk) 17:15, 1 February 2024 (UTC)
Thanks pointing that out. I reverted the copernicus edit, that seemed out of line with the discussions we've been having. Some edits happening here have been too aggressive and need to go through discussion first. Efbrazil (talk) 19:04, 1 February 2024 (UTC)
The article bloat is an issue; I reverted the food section edits just on account of overall word count issues, plus the addition of a graphic that wasn't up to standard. Anything you can do to help out with reviewing and reverting recent edits is helpful. Efbrazil (talk) 20:08, 1 February 2024 (UTC)
Agreed. At an absolute minimum, incremental edits, with specific edit comments, are a necessity in this high-level article (not the first time this issue has been raised). Is it better to simply revert to a version that pre-dated the recent flurry of edits? —RCraig09 (talk) 20:37, 1 February 2024 (UTC)
It's a mix of good and bad. So long as things calm down now I don't know that a full revert is needed, but if you can take time to see what's been done that would be very helpful. I need to stop for today at least. A couple of the new (to this article) graphics have good content but need to have their graphic qualities fixed up and be converted to svg and so forth. Efbrazil (talk) 21:07, 1 February 2024 (UTC)
I would like to point out that right before the start of my recent edits, the article's prose size was at 8692 words. Its "peak" size, just recently, was at 9007 words. Now that the food section has been reverted, it is at 8828 words.
Your mileage may vary and all that, but I do not think that going 7 words over the apparent limit - words which could almost certainly have been trimmed from the other sections of the article - should be described as "bloat" or "word count issue". Not when extremely important detail is lost in the process. Seeing a 136-word difference described as grounds for rollback is...unusual, to put it mildly. InformationToKnowledge (talk) 20:40, 1 February 2024 (UTC)
What I actually find surprising, is that for all the exhausting talk about charts and graphics on this page for the past several weeks, .svg format being a requirement has not been mentioned once. There are .jpg and .png files in this articles which long predate my edits - i.e. or InformationToKnowledge (talk) 20:45, 1 February 2024 (UTC)
JPG and PNG are just worse then SVG, not prohibited. Rasterized content cannot be localized easily, is not accessible, and does not scale well to different screen sizes. For images with no text it is fine though. Another issue is that image text and content should be legible in thumbnail and smartphone view (resembling the size of page text as closely as possible). There are variations from the standard, but we don't want to chunk in stuff that's way off the mark as a rule. Efbrazil (talk) 20:51, 1 February 2024 (UTC)
I think the main point that EfBrazil, RCraig09 and Femke are making towards your recent edits, I2K, is this (as copied from Efbrazil's edit summary: "a full section rewrite shouldn't be one edit. Please be incremental in your edits". For this high level article (FA as well), you need to be far more careful than with all the other articles that we are working on together.
My suggestion is to always describe your intentions on the talk page first and then to edit incrementally. One or two sentences at a time. Or, if the entire section needs rewriting, get consensus on the talk page first. I think in this instance you are intending to bring in content from effects of climate change on agriculture which you improved and updated a lot (with regards to food security issues), right? EMsmile (talk) 20:47, 1 February 2024 (UTC)
Questionable phrasing in the present [01.02.2024] article
Some of these examples are in the lead, so literally cannot be altered without notification here as is policy, and I suppose incrementalism means I should name the others here as well.
Amplified warming in the Arctic has contributed to melting permafrost, glacial retreat and sea ice loss. Permafrost does not melt; it thaws. Scientific literature very specifically uses terms "permafrost thaw". Further, that sentence, which starts with "Amplified warming in the Arctic", somehow cites The Guardian article about Antarctica. (The changes to Southern Ocean overturning circulation I have been working on the other week.)
Additional warming will increase these impacts and can trigger tipping points, such as the melting of the Greenland ice sheet. I really do not like this wording, as it implies that the ice sheet did not start melting yet. I think it may not necessarily be the best tipping point to cite in the lead, because the all alternatives also seem misleading in some way - i.e. "collapse" would imply a fast process rather than a millennia-long one, while "irreversible melting" would not be very accurate now that studies suggest much of the melting could be reversed with relatively limited carbon dioxide removal (limited next to what preserving the WAIS would require, that is, as we at least would not have to enter a "colder-than-preindustrial" state.) I am leaning towards citing the Amazon Rainforest instead, as the process ("die-off/dieback to a grassy savannah state irreversible on human timescales) seems easier to explain. (Though, there is potentially the issue where it can be tipped through "normal" deforestation alone.)
The Northern Hemisphere and the North Pole have warmed much faster than the South Pole and Southern Hemisphere. The Northern Hemisphere not only has much more land, but also more seasonal snow cover and sea ice. As these surfaces flip from reflecting a lot of light to being dark after the ice has melted, they start absorbing more heat. Local black carbon deposits on snow and ice also contribute to Arctic warming. Arctic temperatures are increasing at over twice the rate of the rest of the world. Melting of glaciers and ice sheets in the Arctic disrupts ocean circulation, including a weakened Gulf Stream, further changing the climate
My main issue with the above is the similarity of this wording, in "Differences by region", with this paragraph in "Climate change feedback"
Another major feedback is the reduction of snow cover and sea ice in the Arctic, which reduces the reflectivity of the Earth's surface. More of the Sun's energy is now absorbed in these regions, contributing to amplification of Arctic temperature changes. Arctic amplification is also melting permafrost, which releases methane and CO2 into the atmosphere. Overall, climate feedbacks are expected to become increasingly positive.
If we want to talk about bloat, wouldn't it be a good idea to try talking about ice-albedo feedback in only one section, and not two?
There are further issues here:
"over twice the rate of the rest of the world" is dated phrasing, as numerous studies now use 3-4 times faster figure. (See the article on amplification.)
"Gulf Stream" and AMOC are not equal to each other, and we should not use these terms interchangeably in a top-level article. Further, if we mention AMOC, we should also mention its Southern Ocean twin, though the entire section would have to be more generally worded.
Once again, permafrost does not "melt".
"climate feedbacks are expected to become increasingly positive" is potentially strongly misleading wording to any reader who does not know that the net sum of feedbacks is expected to remain negative. I believe we talked about this before on Talk: Climate change feedback.
Around half of human-caused CO2 emissions have been absorbed by land plants and by the oceans. Climate change increases droughts and heat waves that inhibit plant growth, which makes it uncertain whether this carbon sink will continue to grow. Soils contain large quantities of carbon and may release some when they heat up. As more CO2 and heat are absorbed by the ocean, it acidifies, its circulation changes and phytoplankton takes up less carbon, decreasing the rate at which the ocean absorbs atmospheric carbon. Overall, at higher CO2 concentrations the Earth will absorb a reduced fraction of our emissions. AR6 WG1, even in its SPM, makes it very clear that the reduced fraction will be from an increased amount of emission, and the gross amount of carbon absorbed will be higher than now. In the currently existing paragraph, this fact is...not obvious.
The 2017 United States-published National Climate Assessment notes that "climate models may still be underestimating or missing relevant feedback processes". - This statement is nearly 7 years old. What would be the appropriate venue to search for the newer alternative. NCAR5? AR6? Something else?
Global sea level is rising as a consequence of glacial melt, melt of the Greenland ice sheets and Antarctica, and thermal expansion. There is one Greenland ice sheet. In this sentence "glacial melt, melt of the" is not an obvious distinction without looking at the link name - which I believe is frowned upon. If readability is so important, why not just settle for "due to thermal expansion and the melting of glaciers and ice sheets?"
Over the 21st century, the IPCC projects that in a very high emissions scenario the sea level could rise by 61–110 cm. Increased ocean warmth is undermining and threatening to unplug Antarctic glacier outlets, risking a large melt of the ice sheet and the possibility of a 2-meter sea level rise by 2100 under high emissions Wondering if the focus on high scenario only appropriate. Unsure if "unplug" is necessarily the most obvious or understandable phrase. I am also surprised that this section uses NCAR 2017, and not the 2300 sea level rise graphic.
Higher atmospheric CO2 concentrations have led to changes in ocean chemistry. An increase in dissolved CO2 is causing oceans to acidify. Seems like much or all of the first sentence may be cut?
An example is the collapse of West Antarctic and Greenland ice sheets, where a temperature rise of 1.5 to 2 °C may commit the ice sheets to melt, although the time scale of melt is uncertain and depends on future warming. In the past year, there have been several new lines of evidence suggesting that the WAIS is already committed to melting. Conversely, at least one paper found that much of GrIS would remain at 1.5C. "time scale of melt is uncertain and depends on future warming" - should we be so hesitant that we avoid saying it'll generally take thousands of years? (see tipping points in the climate system and the material in that article based on Armstrong McKay et al., 2022)
Some large-scale changes could occur over a short time period, such as a shutdown of certain ocean currents like the Atlantic meridional overturning circulation (AMOC) "short time period" is fairly WP:WEASEL in this context. Is 15 years (fastest possible timeline according to Armstrong McKay et al., 2022) "short" on a geological timescale? Certainly. Is that what a reader is likely to think when they see this phrase? Unlikely. That's before we get to the more likely timescale (50 years, according to the same.)
With worst-case climate change, models project that almost one-third of humanity might live in extremely hot and uninhabitable climates. "Live"... in "uninhabitable" climates? This wording is clearly self-contradictory. I looked at the cited reference, and, to be fair, it used a similar wording - perhaps even too similar.
"Worst-case scenario models that assume business-as-usual approaches to climate change predict that nearly one-third of the global population will live in extremely hot (uninhabitable) climates, currently found in less than 1% of the earth’s surface mainly in the Sahara."
I'll leave you to decide if this paraphrasing is too close or not. I'll also point out that the reference for that claim in the paper does not seem to use the phrase "uninhabitable", so dropping this word may be acceptable if it avoids self-contradictory structure.
As of 2021, based on information from 48 national climate plans, which represent 40% of the parties to the Paris Agreement, estimated total greenhouse gas emissions will be 0.5% lower compared to 2010 levels, below the 45% or 25% reduction goals to limit global warming to 1.5 °C or 2 °C, respectively Is this for year 2021 emissions specifically? If yes, does this belong in a top-level article in 2024? InformationToKnowledge (talk) 22:05, 1 February 2024 (UTC)
Thanks for doing this. Regarding the greenland ice sheet, I made an incremental change for now to indicate the melting is of the entire ice sheet. The Amazon Rainforest is more compelling, but as you said deforestation is the larger threat there, at least in the short term. It is best to cite examples that are exclusive to climate change. I'll add more comments here as I integrate changes. It looks like some of your suggestions were already processed by others. Efbrazil (talk) 18:37, 2 February 2024 (UTC)
Regarding the redundancy of albedo being mentioned in both "Differences by region" and "Climate change feedback", I think the sections are mostly making different points, although there is necessarily some overlap. The regional section is talking about how climate change is uniquely impacting the arctic / gulf stream, while the feedbacks section is talking about albedo and methane from permafrost and so forth.
Having said that, if you see a way to trim some content there then go ahead and make an incremental edit. To be clear, there's no problem with you making edits so long as they aren't a flood, don't introduce poor quality graphics, are incremental, and don't add significantly to the article word count. If you can work in those parameters then all good. Efbrazil (talk) 18:52, 2 February 2024 (UTC)
As for the rest, I'll comment briefly here, but they are all content areas and I think you can just go in and make changes, just be incremental and careful. I'll briefly address the issues as I see them here. I'm numbering them for ease of reference:
re: over twice the rate of the rest of the world: If you have a source to update this then go ahead
re: "Gulf Stream" and AMOC are not equal to each other, and we should not use these terms interchangeably in a top-level article: I don't see the existing text using them interchangeably. Be careful minimize word count additions and acronyms (AMOC). Saying gulf stream is desirable as it's the familiar term.
If you want to change "melt" to "thaw" everywhere nobody is going to complain
"climate feedbacks are expected to become increasingly positive" is trying to relay the AR6 statement that the change in feedbacks will be in the warming direction going forward for the rest of this century. Maybe could be worded better?
re: AR6 WG1, even in its SPM, makes it very clear that the reduced fraction will be from an increased amount of emission: You can maybe just check the reference and change "Overall, at higher CO2 concentrations" to "Overall, at higher CO2 emissions".
re: The 2017 United States-published National Climate Assessment notes that "climate models may still be underestimating or missing relevant feedback processes". - This statement is nearly 7 years old. What would be the appropriate venue to search for the newer alternative. NCAR5? AR6? Something else?: AR6 is our go to for consensus science on the issue, but I don't recall it speaking to the issue. You could simply cut the statement as being out of date, or leave it in since it is at least explicit about the date of the information.
re: Global sea level is rising as a consequence of glacial melt, melt of the Greenland ice sheets and Antarctica, and thermal expansion. There is one Greenland ice sheet. In this sentence "glacial melt, melt of the" is not an obvious distinction without looking at the link name - which I believe is frowned upon. If readability is so important, why not just settle for "due to thermal expansion and the melting of glaciers and ice sheets?": Good change; since the original text was incorrect, I just made this edit.
Regarding ice sheet melt and using high estimate, I agree it is best to use a moderate estimate like 2.0 C or 3.0 C instead. For timelines, we generally try to keep things focused on this century because that's what's most relevant and important. We'll all be dead by 2100, and it's hard to say what technology will be in play next century.
Regading the ocean chemistry comment, I'd look to move that to the first sentence of the paragraph, so it introduces the full content of the paragraph. Wikipedia and this article often have the problem of sourcing resulting in disjointed sentences and paragraphs.
Sure, if there's new sources saying the WAIS could already be tipped then add those and update the content.
AMOC shutdown timescale: Feel free to be specific if you have a source with a number.
My reading of "one-third of the global population will live in extremely hot (uninhabitable) climates" is that they are saying those people will need to migrate as they won't be able to live there, but I agree the wording is less than ideal. I wouldn't mind cutting the content as it is just one study, not consensus science that we try to focus this article on.
As of 2021,...: If you want to update content then go for it. Otherwise 2021 is still pretty recent and doesn't need to be trimmed as yet.
I acted on all of this besides 4 (will have to decide on reference choice), 6 (will have to dig through the reports later), 12 (since a separate discussion on it broke out further down) and 13 (does not seem worth changing yet.)
I guess 9 is partial since I'm not sure on how you intended to restructure that entire paragraph.
For 2, I came up with a fairly unusual approach to avoid acronyms and mention both overturning circulations.
For 5, I went for stronger changes to wording, but I think they work fairly well.
For 10, the number of references is likely too large, but I would like to leave the choice on which ones to remove to someone else.
For 11, I didn't commit too much detail to AMOC timescale, since it's effectively the most controversial tipping point right now, and instead used a recent reference to rewrite the sentence on GrIS melting as well.
Bold proposal, let tipping points define the structure of the chapter 'Impacts':
5. Impacts
5.1 Current impacts till +1.5 °C
5.2 Impacts +1.5 - 2.0 °C
5.3 Impacts beyond +2.0 °C
The current overlap between environment, nature and food will seize to exist. It will be easy to avoid duplicate text. Impacts of a tipping point will flock together. Uwappa (talk) 07:58, 5 February 2024 (UTC)
I feel that if we did something like that, we would probably want to follow a similar structure as . However, that is a little besides the point for now, as it seems like no real notable addition to this page can be made right now without running into size limits. I have been deeply skeptical of that Causes of Climate change renaming proposal (see "Please ensure" heading from a couple days ago), but if there's anything which might be make supportive of it, it's the promise that with several hundreds of words moved out and article space expanded, we would finally be able to avoid neglecting or oversimplifying certain impacts. InformationToKnowledge (talk) 09:55, 5 February 2024 (UTC)
I don't think this proposed structure would work and serve our readers well. There would also be a lot of repetition between those sub-sections (unless you'd make it "Additional impacts beyond +2 deg C". But for lay person readers things like 1 or 2 degrees plus don't mean much. I think they start listening and relating more when it's about increased severity of floods and droughts etc (and therefore, I would reflect that in the sub-section headings).
Regarding moving some content from the "causes" section to a possible new article on causes of climate change I would be in favour of that. EMsmile (talk) 10:08, 5 February 2024 (UTC)
Agreed with EMsmile. Plus I don't think you can separate them that easily. What dates are those C's? Impacts +1.5 - 2.0 C by 2050? That would be also under Impacts beyond +2.0 C by 2100 etc. Bogazicili (talk) 16:21, 5 February 2024 (UTC)
We actually had a similar discussion about this 2 years ago (started by User:אלכסנדר סעודה), I found it again by searching the archives for "by degree": https://en.wikipedia.org/wiki/Talk:Effects_of_climate_change/Archive_7#Table_of_effects and here: https://en.wikipedia.org/wiki/Wikipedia_talk:WikiProject_Climate_change/Archive_2#Climate_change_degree_by_degree EMsmile (talk) 16:34, 5 February 2024 (UTC)
It will be good in my opinion to write a separate page climate change degree by degree specially dedicated to this with link from the page climate change. But it will not be good to change the section inside the summary page because it should talk not only about the impacts by degees but also abour many other things.
There is some table about this in the page IPCC Sixth Assessment Report in the section about important finding of WG 1 group, we can add it to the page.
Yeah, that works for me, and makes more sense than a separate article. Just so long as we don't bloat the Impacts section in this article. Efbrazil (talk) 17:56, 6 February 2024 (UTC)
Chart for getting closer and closer to +1.5C
See
https://climate.copernicus.eu/weve-lost-19-years-battle-against-global-warming-paris-agreement
and an application with a history of forecasts at:
@Uwappa: This article is about climate change itself. The 1.5° threshold is relevant, and the date of reaching that threshold is a secondary issue, and the changes in predictions of reaching that threshold is a third issue further removed from climate change itself. We can tell you're putting a lot of work into graphics (and this one is very clever), but I think this graphic is not adequately relevant to this highest-level article, which is already very, very long. Another issue is that it is hard for most readers to WP:Verify the accuracy of the chart since it requires an external tool that relies on one organization's data; especially in highest-level articles, we're careful to present exactly what sources explicitly state. Sorry, but I'm not sure where this graphic can find a home on Wikipedia. —RCraig09 (talk) 15:49, 9 January 2024 (UTC)
Unfortunately, I have to agree to a certain extent. It's a very cool graph, but I don't know if there's a way to get it on a Wikipedia article. Professor Penguino (talk) 08:46, 12 January 2024 (UTC)
BBC reports: "World's first year-long breach of key 1.5C warming limit"
That is a 12 month period, a year, not the 20 year average yet. Uwappa (talk) 06:37, 8 February 2024 (UTC)
British English?
I want to add the language template on this talk page. I think the article should get the British English tag, right (mainly written in British English?)? If so, I've spotted some American spellings which I would then change to British English. See WP:ENGVAREMsmile (talk) 21:07, 6 February 2024 (UTC)
Yes indeed. And I table that we need better pavements to get petrolheads out of their old bangers. Also bangers should be veggie. Chidgk1 (talk) 17:57, 8 February 2024 (UTC)
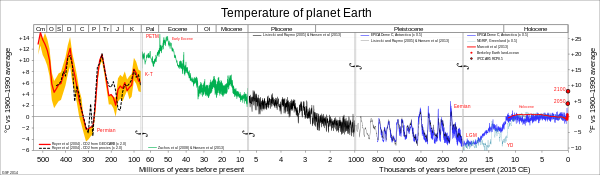


 , hard to distinguish individual years, but great to see the big picture, from old to recent. It may be better to cut down the number of curves, show decade averages. For the proof of concept a year legend would distract, make the fake data look too real, so I left it out, just like the location.
 ? That would take us back to the Italian video fragment, visually appealing, impressive show during a presentation but a burden for short term memory. See the past, but not yet the current. See the current, but not the past anymore. The proposed alternative is to show a range of years, past and present in one graphic. Uwappa (talk) 08:57, 14 November 2023 (UTC)


 2024 could even have many days above +2.0C. Serious climate change is not something of a distant future, it is current.
 at the top of chapter '2. Global temperature rise'. It will show 2000 years of history and the current rapid rise. That graph is like a summary of the whole chapter. That graph is currently misplaced in "Temperature records prior to global warming".


 for another example of real data and trends.
 but it worked amazingly well. See older versions of that chart for how a line was far worse than dots. Please try offline and upload a new version only if you like the result. Uwappa (talk) 01:23, 30 January 2024 (UTC)
 and
and  or
or  InformationToKnowledge (talk) 20:45, 1 February 2024 (UTC)
 . However, that is a little besides the point for now, as it seems like no real notable addition to this page can be made right now without running into size limits. I have been deeply skeptical of that Causes of Climate change renaming proposal (see "Please ensure" heading from a couple days ago), but if there's anything which might be make supportive of it, it's the promise that with several hundreds of words moved out and article space expanded, we would finally be able to avoid neglecting or oversimplifying certain impacts. InformationToKnowledge (talk) 09:55, 5 February 2024 (UTC)
