Renewable energy is often deployed together with further electrification, which has several benefits: electricity can move heat or objects efficiently, and is clean at the point of consumption. From 2011 to 2021, renewable energy grew from 20% to 28% of global electricity supply. Use of fossil energy shrank from 68% to 62%, and nuclear from 12% to 10%. The share of hydropower decreased from 16% to 15% while power from sun and wind increased from 2% to 10%. Biomass and geothermal energy grew from 2% to 3%. There are 3,146 gigawatts installed in 135 countries, while 156 countries have laws regulating the renewable energy sector. In 2021, China accounted for almost half of the global increase in renewable electricity.
Renewable energy systems are rapidly becoming more efficient and cheaper and their share of total energy consumption is increasing, with a large majority of worldwide newly installed electricity capacity being renewable. In most countries, photovoltaic solar or onshore wind are the cheapest new-build electricity.
Many nations around the world already have renewable energy contributing more than 20% of their total energy supply, with some generating over half their electricity from renewables. A few countries generate all their electricity using renewable energy. National renewable energy markets are projected to continue to grow strongly in the 2020s and beyond. According to the IEA, to achieve net zero emissions by 2050, 90% of global electricity generation will need to be produced from renewable sources. Some studies say that a global transition to 100% renewable energy across all sectors – power, heat, transport and industry – is feasible and economically viable.
Renewable energy resources exist over wide geographical areas, in contrast to fossil fuels, which are concentrated in a limited number of countries. Deployment of renewable energy and energy efficiency technologies is resulting in significant energy security, climate change mitigation, and economic benefits. However renewables are being hindered by hundreds of billions of dollars of fossil fuel subsidies. In international public opinion surveys there is strong support for renewables such as solar power and wind power. In 2022 the International Energy Agency asked countries to solve policy, regulatory, permitting and financing obstacles to adding more renewables, to have a better chance of reaching net zero carbon emissions by 2050. (Full article...)
The dam was authorized in 1944 as a unit of the federal Central Valley Project, a system designed to provide irrigation water to the fertile agricultural region of the Central Valley. It would be built by the U.S. Army Corps of Engineers (Corps), and transferred to the U.S. Bureau of Reclamation (Reclamation) upon completion. In 1966, work began to clear the foundations for a high dam that would replace an earlier, much smaller structure built by two irrigation districts. Construction of the main embankment began in 1976, and was topped out in late 1978. The filling of New Melones Lake began in 1978, and the dam's hydroelectric station produced its first power in mid-1979.
New Melones was the focus of a long environmental battle during the 1970s and early 1980s; critics protested the flooding of a long scenic stretch of the Stanislaus River, which flowed over whitewater rapids through the deepest limestone canyon in the western United States. The protestors employed a variety of methods, some extreme, to prevent the filling of New Melones Lake until 1983, when record-setting floods filled the reservoir and nearly breached the dam's emergency spillway. The fight over New Melones galvanized the river conservation movement in California and influenced major water policy changes on the state and federal levels; since its completion, no other dams of its size or importance have been built in the United States. (Full article...)
"First, once the renewable infrastructure is built, the fuel is free forever. Unlike carbon-based fuels, the wind and the sun and the earth itself provide fuel that is free, in amounts that are effectively limitless."
"Second, while fossil fuel technologies are more mature, renewable energy technologies are being rapidly improved. So innovation and ingenuity give us the ability to constantly increase the efficiency of renewable energy and continually reduce its cost."
"Third, once the world makes a clear commitment to shifting toward renewable energy, the volume of production will itself sharply reduce the cost of each windmill and each solar panel, while adding yet more incentives for additional research and development to further speed up the innovation process."
Denis Allen Hayes (born August 29, 1944) is an environmental advocate and an advocate for solar power. He rose to prominence in 1970 as the coordinator for the first Earth Day.
... that the first recorded instance of solar distillation was by 16th century Arab alchemists? A large-scale solar distillation project was first constructed in 1872 in Chile a mining town of Las Salinas. The plant, which had a solar collection area of 4,700 m², could produce up to 22,700 L per day and operated for 40 years. Individual still designs include single-slope, double-slope (or greenhouse type), vertical, conical, inverted absorber, multi-wick, and multiple effect. These stills can operate in passive, active, or hybrid modes. Double-slope stills are the most economical for decentralized domestic purposes, while active multiple effect units are more suitable for large-scale applications.
General images - load new batch
The following are images from various renewable energy-related articles on Wikipedia.
Image 8Parabolic dish produces steam for cooking, in Auroville, India. (from Solar energy)
Image 9Merowe Dam in Sudan. Hydroelectric power stations that use dams submerge large areas of land due to the requirement of a reservoir. These changes to land color or albedo, alongside certain projects that concurrently submerge rainforests, can in these specific cases result in the global warming impact, or equivalent life-cycle greenhouse gases of hydroelectricity projects, to potentially exceed that of coal power stations. (from Hydroelectricity)
Image 10Electricity generation at Ohaaki, New Zealand (from Geothermal energy)
Image 21A turbine blade convoy passing through Edenfield in the U.K. (2008). Even longer 2-piece blades are now manufactured, and then assembled on-site to reduce difficulties in transportation. (from Wind power)
Image 22Wind turbines such as these, in Cumbria, England, have been opposed for a number of reasons, including aesthetics, by some sectors of the population. (from Wind power)
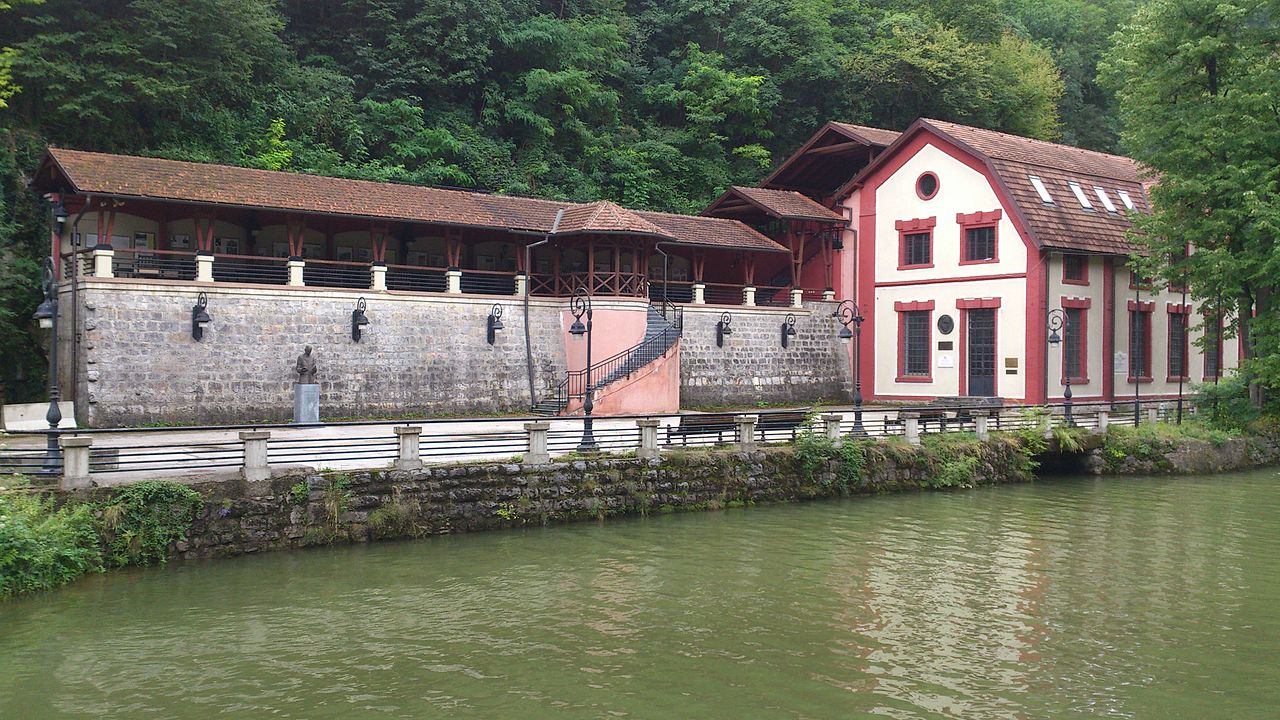
Image 23The Warwick Castle water-powered generator house, used for the generation of electricity for the castle from 1894 until 1940 (from Hydroelectricity)
Image 39Distribution of wind speed (red) and energy (blue) for all of 2002 at the Lee Ranch facility in Colorado. The histogram shows measured data, while the curve is the Rayleigh model distribution for the same average wind speed. (from Wind power)
Image 40Greenhouses like these in the Westland municipality of the Netherlands grow vegetables, fruits and flowers. (from Solar energy)
Image 41Seasonal cycle of capacity factors for wind and photovoltaics in Europe under idealized assumptions. The figure illustrates the balancing effects of wind and solar energy at the seasonal scale (Kaspar et al., 2019). (from Wind power)
Image 42Wind turbine floating off France (from Wind power)
Image 43Concentrated solar panels are getting a power boost. Pacific Northwest National Laboratory (PNNL) will be testing a new concentrated solar power system – one that can help natural gas power plants reduce their fuel usage by up to 20 percent.[needs update] (from Solar energy)
Image 45Solar water heaters facing the Sun to maximize gain (from Solar energy)
Image 46Greenhouse gas emissions per energy source. Wind energy is one of the sources with the least greenhouse gas emissions. (from Wind power)
Image 47The Hoover Dam in the United States is a large conventional dammed-hydro facility, with an installed capacity of 2,080 MW. (from Hydroelectricity)
Image 49Installed geothermal energy capacity, 2022 (from Geothermal energy)
Image 50Enhanced geothermal system 1:Reservoir 2:Pump house 3:Heat exchanger 4:Turbine hall 5:Production well 6:Injection well 7:Hot water to district heating 8:Porous sediments 9:Observation well 10:Crystalline bedrock (from Geothermal energy)
Image 52Geothermal power station in the Philippines (from Geothermal energy)
Image 53Acceptance of wind and solar facilities in one's community is stronger among U.S. Democrats (blue), while acceptance of nuclear power plants is stronger among U.S. Republicans (red). (from Wind power)
Image 54Global geothermal electric capacity. Upper red line is installed capacity; lower green line is realized production. (from Geothermal energy)
Image 55Electricity generation at Wairakei, New Zealand (from Geothermal energy)


.jpg/1280px-Squad_Solar_Car_(Fully_Charged_2022).jpg)


![Image 43Concentrated solar panels are getting a power boost. Pacific Northwest National Laboratory (PNNL) will be testing a new concentrated solar power system – one that can help natural gas power plants reduce their fuel usage by up to 20 percent.[needs update] (from Solar energy)](http://upload.wikimedia.org/wikipedia/commons/thumb/8/82/Photo_of_the_Week-_Boosting_Solar_Technology_(8722948189).jpg/1280px-Photo_of_the_Week-_Boosting_Solar_Technology_(8722948189).jpg)


.jpg)
.jpg)