Many climate change impacts have been felt in recent years, with 2023 the warmest on record at +1.48 °C (2.66 °F) since regular tracking began in 1850. Additional warming will increase these impacts and can trigger tipping points, such as melting all of the Greenland ice sheet. Under the 2015 Paris Agreement, nations collectively agreed to keep warming "well under 2 °C". However, with pledges made under the Agreement, global warming would still reach about 2.7 °C (4.9 °F) by the end of the century. Limiting warming to 1.5 °C will require halving emissions by 2030 and achieving net-zero emissions by 2050.
Diagram of factors that determine climate sensitivity. After increasing CO2 levels, there is an initial warming. This warming gets amplified by the net effect of climate feedbacks.
Climate sensitivity is a key measure in climate science and describes how much Earth's surface will warm for a doubling in the atmospheric carbon dioxide (CO2) concentration. Its formal definition is: "The change in the surface temperature in response to a change in the atmospheric carbon dioxide (CO2) concentration or other radiative forcing." This concept helps scientists understand the extent and magnitude of the effects of climate change.
Scientists do not know exactly how strong these climate feedbacks are. Therefore, it is difficult to predict the precise amount of warming that will result from a given increase in greenhouse gas concentrations. If climate sensitivity turns out to be on the high side of scientific estimates, the Paris Agreement goal of limiting global warming to below 2 °C (3.6 °F) will be difficult to achieve. (Full article...)
The Ocean Circulation Conveyor Belt. The ocean plays a major role in the distribution of the planet's heat through deep sea circulation. This simplified illustration shows this "conveyor belt" circulation.
The following are images from various climate-related articles on Wikipedia.
Image 1This diagram of the fast carbon cycle shows the movement of carbon between land, atmosphere, and oceans in billions of metric tons of carbon per year. Yellow numbers are natural fluxes, red are human contributions, white are stored carbon. (from Carbon dioxide in Earth's atmosphere)
Image 4A Sankey diagram illustrating a balanced example of Earth's energy budget. Line thickness is linearly proportional to relative amount of energy. (from Earth's energy budget)
Image 6Warming influence of atmospheric greenhouse gases has nearly doubled since 1979, with carbon dioxide and methane being the dominant drivers. (from Causes of climate change)
Image 7Over 400,000 years of ice core data: Graph of CO2 (green), reconstructed temperature (blue) and dust (red) from the Vostok ice core (from Carbon dioxide in Earth's atmosphere)
Image 11Global average temperatures show that the Medieval Warm Period was not a planet-wide phenomenon, and that the Little Ice Age was not a distinct planet-wide time period but rather the end of a long temperature decline that preceded recent global warming. (from Temperature record of the last 2,000 years)
Image 15The impact of the greenhouse effect on climate was presented to the public early in the 20th century, as succinctly described in this 1912 Popular Mechanics article. (from History of climate change science)
Image 16Sea ice reflects 50% to 70% of incoming sunlight, while the ocean, being darker, reflects only 6%. As an area of sea ice melts and exposes more ocean, more heat is absorbed by the ocean, raising temperatures that melt still more ice. This is a positive feedback process. (from Causes of climate change)
Image 17The rate of global tree cover loss has approximately doubled since 2001, to an annual loss approaching an area the size of Italy. (from Causes of climate change)
Image 18Earth's energy balance and imbalance, showing where the excess energy goes: Outgoing radiation is decreasing owing to increasing greenhouse gases in the atmosphere, leading to Earth's energy imbalance of about 460 TW. The percentage going into each domain of the climate system is also indicated. (from Earth's energy budget)
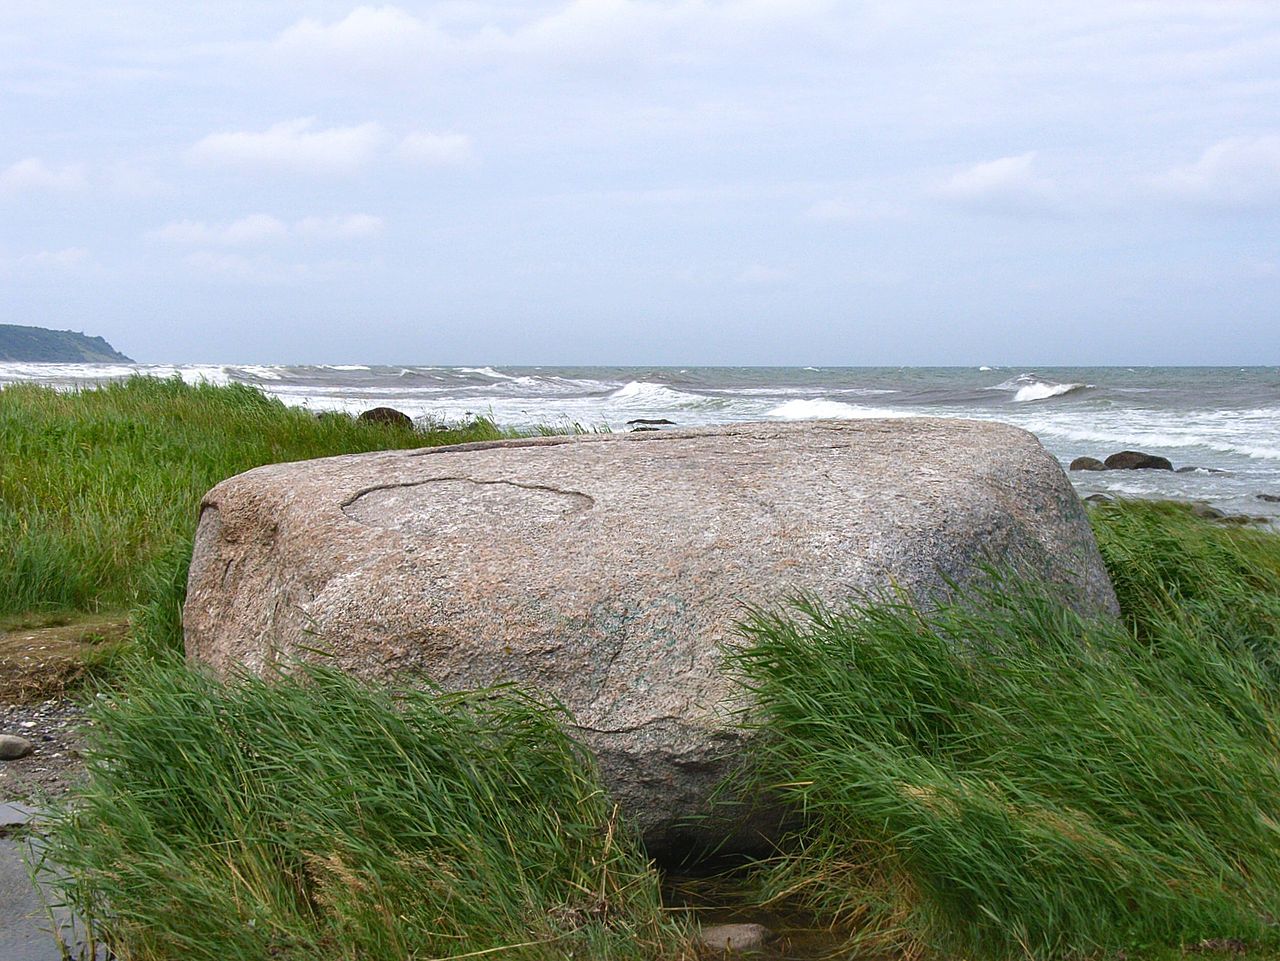
Image 20Erratics, boulders deposited by glaciers far from any existing glaciers, led geologists to the conclusion that climate had changed in the past. (from History of climate change science)
Image 21Meat from cattle and sheep have the highest emissions intensity of any agricultural commodity. (from Causes of climate change)
Image 24Scientific consensus on causation:Academic studies of scientific agreement on human-caused global warming among climate experts (2010–2015) reflect that the level of consensus correlates with expertise in climate science. A 2019 study found scientific consensus to be at 100%, and a 2021 study concluded that consensus exceeded 99%. Another 2021 study found that 98.7% of climate experts indicated that the Earth is getting warmer mostly because of human activity. (from History of climate change science)
Image 25The rising accumulation of energy in the oceanic, land, ice, and atmospheric components of Earth's climate system since 1960. (from Earth's energy budget)
Image 27Earth's energy budget (in W/m2) determines the climate. It is the balance of incoming and outgoing radiation and can be measured by satellites. The Earth's energy imbalance is the "net absorbed" energy amount and grew from +0.6 W/m2 (2009 est.) to above +1.0 W/m2 in 2019. (from Earth's energy budget)
Image 29Air pollution has substantially increased the presence of aerosols in the atmosphere when compared to the preindustrial background levels. Different types of particles have different effects, but overall, cooling from aerosols formed by sulfur dioxide emissions has the overwhelming impact. However, the complexity of aerosol interactions in atmospheric layers makes the exact strength of cooling very difficult to estimate. (from Causes of climate change)
Image 30Mean temperature anomalies during the period 1965 to 1975 with respect to the average temperatures from 1937 to 1946. This dataset was not available at the time. (from History of climate change science)
Image 34CO2 sources and sinks since 1880. While there is little debate that excess carbon dioxide in the industrial era has mostly come from burning fossil fuels, the future strength of land and ocean carbon sinks is an area of study. (from Causes of climate change)
Image 35Observed temperature from NASA vs the 1850–1900 average used by the IPCC as a pre-industrial baseline. The primary driver for increased global temperatures in the industrial era is human activity, with natural forces adding variability. (from Causes of climate change)
Image 38Schematic drawing of Earth's excess heat inventory and energy imbalance for two recent time periods. (from Earth's energy budget)
Image 39Since the 1980s, global average surface temperatures during a given decade have almost always been higher than the average temperature in the preceding decade. (from History of climate change science)
Image 40Between 1850 and 2019 the Global Carbon Project estimates that about 2/3rds of excess carbon dioxide emissions have been caused by burning fossil fuels, and a little less than half of that has stayed in the atmosphere. (from Carbon dioxide in Earth's atmosphere)
Image 41Atmospheric CO2 concentration measured at Mauna Loa Observatory in Hawaii from 1958 to 2023 (also called the Keeling Curve). The rise in CO2 over that time period is clearly visible. The concentration is expressed as μmole per mole, or ppm. (from Carbon dioxide in Earth's atmosphere)
Image 42Carbon dioxide observations from 2008 to 2017 showing the seasonal variations and the difference between northern and southern hemispheres (from Carbon dioxide in Earth's atmosphere)
Image 43The US, China and Russia have cumulatively contributed the greatest amounts of CO2 since 1850. (from Carbon dioxide in Earth's atmosphere)
Image 44Annual CO2 flows from anthropogenic sources (left) into Earth's atmosphere, land, and ocean sinks (right) since year 1960. Units in equivalent gigatonnes carbon per year. (from Carbon dioxide in Earth's atmosphere)
Image 45Drivers of climate change from 1850–1900 to 2010–2019. There was no significant contribution from internal variability or solar and volcanic drivers. (from Causes of climate change)
Image 48The growth in Earth's energy imbalance from satellite and in situ measurements (2005–2019). A rate of +1.0 W/m2 summed over the planet's surface equates to a continuous heat uptake of about 500 terawatts (~0.3% of the incident solar radiation). (from Earth's energy budget)
Image 49Greenhouse gases allow sunlight to pass through the atmosphere, heating the planet, but then absorb and redirect the infrared radiation (heat) the planet emits (from Carbon dioxide in Earth's atmosphere)
Image 50Cumulative land-use change contributions to CO2 emissions, by region. (from Causes of climate change)
Image 52Energy flows between space, the atmosphere, and Earth's surface. Rising greenhouse gas levels are contributing to an energy imbalance. (from Causes of climate change)
Image 53Photosynthesis changes sunlight into chemical energy, splits water to liberate O2, and fixes CO2 into sugar. (from Carbon dioxide in Earth's atmosphere)
Image 54CO2 concentrations over the last 800,000 years as measured from ice cores (blue/green) and directly (black) (from Causes of climate change)
Image 55Modeled simulation of the effect of various factors (including GHGs, Solar irradiance) singly and in combination, showing in particular that solar activity produces a small and nearly uniform warming, unlike what is observed. (from History of climate change science)
Image 56Terms like "climate emergency" and climate crisis" have often been used by activists, and are increasingly found in academic papers. (from History of climate change science)
Image 57CO2 reduces the flux of thermal radiation emitted to space (causing the large dip near 667 cm−1), thereby contributing to the greenhouse effect. (from Carbon dioxide in Earth's atmosphere)
edit
Did you know – show another
... that global warming of the average air temperature rose 0.74 ± 0.18 °C (1.3 ± 0.32 °F) during the past century?
(Pictured left: Animated global map of monthly long term mean surface air temperature (Mollweide projection))
Sea level trends between 1993 and 2010. Per the U.S. National Oceanic and Atmospheric Administration (NOAA), "The following maps provide estimates of sea level rise based on measurements from satellite radar altimeters. The local trends were estimated using data from TOPEX/Poseidon (T/P), Jason-1, and Jason-2, which have monitored the same ground track since 1992.
An inverted barometer has been applied. The estimates of sea level rise do not include glacial isostatic adjustment effects on the geoid, which are modeled to be +0.2 to +0.5 mm/year when globally averaged."
– When a task is completed, please remove it from the list.
edit
Wikimedia
Global warmingon Wikinews News
Global warmingon Commons Images
Global warmingon Wiktionary Definitions
Global warmingon Wikiquote Quotations
Global warmingon Wikibooks Manuals & Texts
Global warmingon Wikisource Texts
Global warmingon Wikiversity Courses
References
^"GISS Surface Temperature Analysis (v4)". NASA. Retrieved 12 January 2024.
^Bhargav, Vishal (2021-10-11). "Climate Change Is Making India's Monsoon More Erratic". www.indiaspend.com. Retrieved 2021-10-11.
^Tiwari, Dr Pushp Raj; Conversation, The. "Nobel prize: Why climate modellers deserved the physics award – they've been proved right again and again". phys.org. Retrieved 2021-10-11.


.jpg/1280px-NORTH_POLE_Ice_(19626661335).jpg)


.svg)


_at_the_top_of_the_atmosphere_(TOA).png)


.png)


.jpg)