1878 German federal election|
|
|
| Registered | 9,128,305  2.07% 2.07% |
|---|
| Turnout | 5,780,996 (63.33%) 2.69pp |
|---|
|
|
First party
|
Second party
|
Third party
|
|
|

|
|

|
| Leader
|
Rudolf von Bennigsen
|
Ludwig Windthorst
|
Otto von Helldorff
|
| Party
|
NLP
|
Centre
|
DKP
|
| Leader since
|
1867
|
26 May 1874
|
7 June 1876
|
| Last election
|
26.67%, 127 seats
|
24.83%, 93 seats
|
9.59%, 40 seats
|
| Seats won
|
97
|
94
|
59
|
| Seat change
|
 30 30
|
1
|
19
|
| Popular vote
|
1,291,161
|
1,315,720
|
736,826
|
| Percentage
|
22.41%
|
22.84%
|
12.79%
|
| Swing
|
4.26pp
|
1.99pp
|
3.20pp
|
|
|
|
Fourth party
|
Fifth party
|
Sixth party
|
|
|
|
DFP
|
Polen
|
| Leader
|
Viktor I, Duke of Ratibor
|
|
|
| Party
|
DRP
|
DFP
|
Polish Party
|
| Last election
|
7.85%, 38 seats
|
7.64%, 34 seats
|
4.00%, 14 seats
|
| Seats won
|
57
|
26
|
14
|
| Seat change
|
19
|
8
|
 0 0
|
| Popular vote
|
785,631
|
395,065
|
216,148
|
| Percentage
|
13.64%
|
6.86%
|
3.75%
|
| Swing
|
5.79pp
|
0.78pp
|
0.25pp
|
|
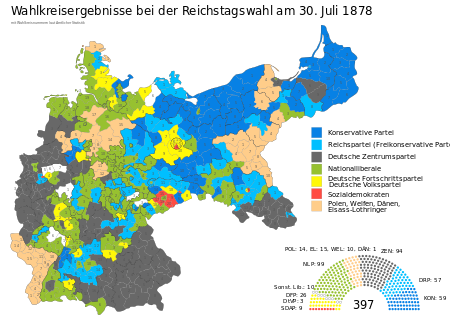 Map of results (by constituencies) |
|
Federal elections were held in Germany on 30 July 1878.[1] The National Liberal Party remained the largest party in the Reichstag with 97 of the 397 seats, despite the Centre Party receiving more votes.[2] Voter turnout was 63.4%.[3]
Results
|
|---|
| Party | Votes | % | +/– | Seats | +/– |
|---|
| Centre Party | 1,315,720 | 22.84 | −1.99 | 94 | +1 |
| National Liberal Party | 1,291,161 | 22.41 | −4.26 | 97 | −30 |
| German Reich Party | 785,631 | 13.64 | +5.79 | 57 | +19 |
| German Conservative Party | 736,826 | 12.79 | +3.20 | 59 | +19 |
| Socialist Workers' Party | 437,158 | 7.59 | −1.55 | 9 | −4 |
| German Progress Party | 395,065 | 6.86 | −0.78 | 26 | −8 |
| Polish Party | 216,148 | 3.75 | −0.25 | 14 | 0 |
| Alsace-Lorraine parties | 178,883 | 3.11 | −0.59 | 15 | 0 |
| German-Hanoverian Party | 106,555 | 1.85 | +0.27 | 10 | +6 |
| Independent liberals | 99,511 | 1.73 | +0.52 | 7 | +2 |
| Löwe-Berger Group | 78,152 | 1.36 | −0.37 | 5 | −4 |
| German People's Party | 68,851 | 1.20 | +0.37 | 3 | −1 |
| Danish Party | 16,145 | 0.28 | −0.04 | 1 | 0 |
| Independent conservatives | 9,936 | 0.17 | −0.26 | 0 | 0 |
| Old Liberals | 8,496 | 0.15 | +0.02 | 0 | 0 |
| Christian Social Party | 3,229 | 0.06 | New | 0 | New |
| Schleswig-Holstein Particularist Liberals | 2,258 | 0.04 | −0.06 | 0 | 0 |
| Others | 10,389 | 0.18 | –0.05 | 0 | 0 |
| Unknown | 833 | 0.01 | 0.00 | 0 | 0 |
| Total | 5,760,947 | 100.00 | – | 397 | 0 |
|
| Valid votes | 5,760,947 | 99.65 | |
|---|
| Invalid/blank votes | 20,049 | 0.35 | |
|---|
| Total votes | 5,780,996 | 100.00 | |
|---|
| Registered voters/turnout | 9,128,305 | 63.33 | |
|---|
| Source: Wahlen in Deutschland |
Alsace-Lorraine
| Party | Votes | % | +/– | Seats | +/– |
|---|
| Protesters | 70,524 | 34.52 | −11.14 | 6 | −1 |
| Clericals | 59,970 | 29.36 | +2.10 | 5 | +2 |
| Autonomists | 48,389 | 23.69 | −1.16 | 4 | −1 |
| German Reich Party | 24,437 | 11.96 | +11.75 | 0 | 0 |
| German Conservative Party | 343 | 0.17 | +0.14 | 0 | 0 |
| Socialist Workers' Party | 141 | 0.07 | New | 0 | New |
| Others | 478 | 0.23 | −0.37 | 0 | 0 |
| Total | 204,282 | 100.00 | – | 15 | 0 |
|
| Valid votes | 204,282 | 98.91 | |
|---|
| Invalid/blank votes | 2,247 | 1.09 | |
|---|
| Total votes | 206,529 | 100.00 | |
|---|
| Registered voters/turnout | 322,310 | 64.08 | |
|---|
| Source: Wahlen in Deutschland |
References

_b_093_(cropped).jpg/1280px-Die_Gartenlaube_(1874)_b_093_(cropped).jpg)
.jpg/1280px-Ludwig_Windthorst_1872_JS_(cropped).jpg)

.jpg/1280px-Victor_Herzog_von_Ratibor_(cropped).jpg)
_b_093_(cropped).jpg)
.jpg)
.jpg)
